Multivariate Secondary Structure Estimation (SSE) with High Throughput CD
August 25, 2022
 Download This Application
Introduction
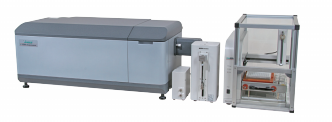
High Throughput CD System for Automated Protein Secondary Structure Estimation
This application note evaluates the use of the J-1500 high throughput CD (HTCD) system for automated protein secondary structure estimation. Measurements reveal information regarding the secondary structure or backbone conformation of a protein. CD measurements can be used to determination the secondary structure content of a biomolecule to elucidate the relationship between structure and function or verify protein stability. The high throughput CD system with JASCO’s multivariate Secondary Structure Estimation (SSE) program can be used to quickly analyze CD data for routine quantitative research and quality control. A large number of samples can be automatically measured and efficiently analyzed using the High-Throughput CD (HTCD) system with Spectra Manager and multivariate SSE program.
The secondary structure of eight proteins are evaluated using the Multivariate SSE program.
Experimental
| Measurement conditions | |||
|---|---|---|---|
| Data acquisition interval | 0.1 nm | Response time | 2 seconds |
| Spectral bandwidth | 1 nm | Scan speed | 100 nm/min |
| Accumulations | 2 times | Path length | 1 mm |
Keywords
Protein secondary structure estimation, protein SSE, circular dichroism, high throughput circular dichrosim, high throughput CD, HTCD, Multivariate, Biochemistry, Pharmaceuticals, multiplate, 96 well plate
Results
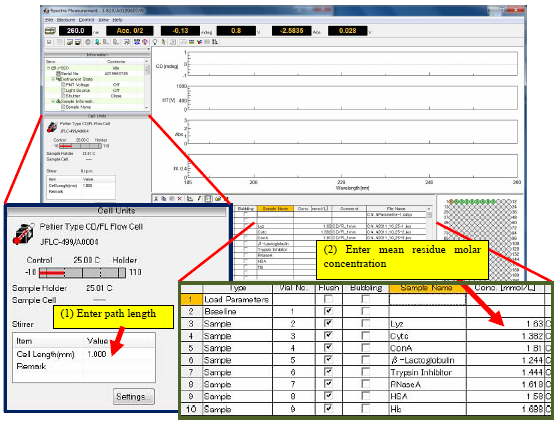
Prior to obtaining the sequence measurement, the pathlength and mean residue molar concentrations have to be specified so that the optical constants can be automatically calculated for the secondary structure estimation (Figure 1).
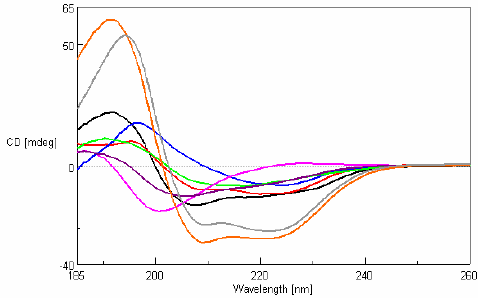
CD measurements in the far-UV region were obtained for eight 0.1 mg/mL protein samples with varying secondary structure compositions and are shown in Figure 2.
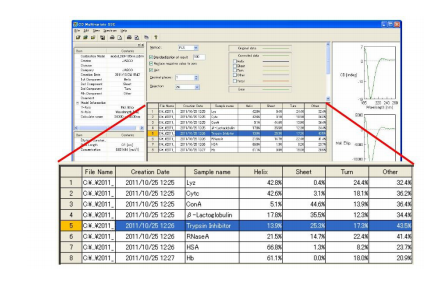
The secondary structure estimated using PLS multivariate analysis of the protein spectra are shown in Figure 1 . Table 1 compares these results with X-ray crystallography data. Figure 3 shows the secondary structure results from the JWMVS program.
Table 1. Comparison of Multivariate SSE results with X-ray crystallography data
| Helix (%) | Sheet (%) | Turn (%) | Other (%) | ||
| Lysozyme (Lyz) | PLS | 42.8 | 0.4 | 24.4 | 32.4 |
| X-ray | 41 | 4 | 19 | 35 | |
| Cytochrome C (CytC) | PLS | 42.6 | 3.1 | 18.1 | 36.2 |
| X-ray | 42 | 8 | 9 | 42 | |
| Concanavalin A (ConA) | PLS | 5.1 | 44.6 | 13.9 | 36.4 |
| X-ray | 2 | 36 | 12 | 49 | |
| β-Lactoglobulin | PLS | 17.8 | 35.5 | 12.3 | 34.4 |
| X-ray | 13 | 34 | 13 | 41 | |
| Trypsin Inhibitor | PLS | 13.9 | 25.3 | 17.3 | 43.5 |
| X-ray | 2 | 33 | 10 | 55 | |
| Ribonuclease A (RNaseA) | PLS | 21.5 | 14.7 | 22.4 | 41.4 |
| X-ray | 22 | 19 | 11 | 48 | |
| Human Serum Albumin (HSA) | PLS | 66.8 | 1.3 | 8.2 | 23.7 |
| X-ray | 72 | 0 | 8 | 20 | |
| Hemoglobin (Hb) | PLS | 61.1 | 0 | 18 | 20.9 |
| X-ray | 75 | 0 | 10 | 15 |
1 W. C. Johnson, Proteins: Structure, Function, and Genetics (1999), 35, 307-312.
2 PDB: Trypsin inhibitor: 1ba7 (DSSP), HAS: 1bm0 (DSSP)
Conclusion
This application note illustrates the use of the Multivariate SSE program to estimate secondary structure following CD measurement. The PLS method shows good agreement with secondary structure results obtained by X-ray crystallography.
Featured Products:
-
Highest performance with a wide range of accessories for maximum flexibility to meet complex research demands.
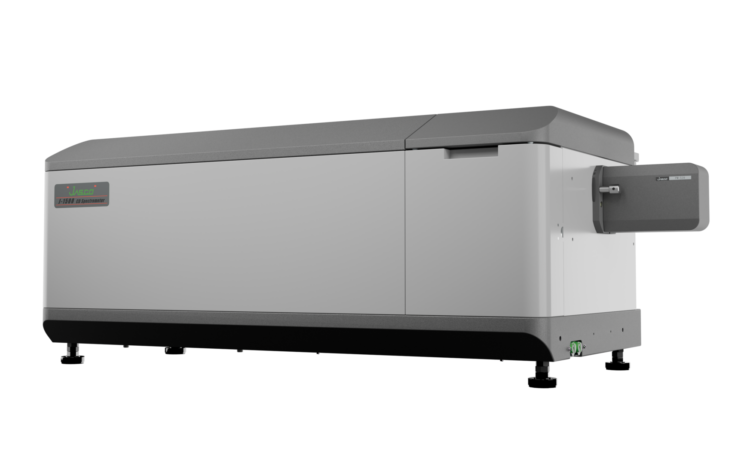
J-1500
-
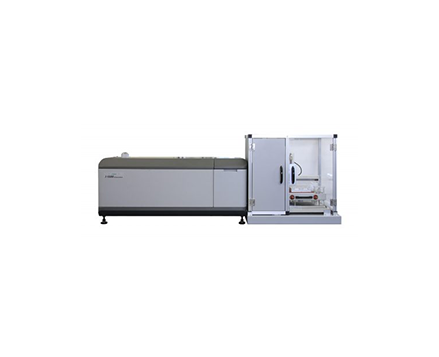
Automated HTCD

Multivariate Secondary Structure Estimation (SSE) with High Throughput CD
Introduction
High Throughput CD System for Automated Protein Secondary Structure Estimation
This application note evaluates the use of the J-1500 high throughput CD (HTCD) system for automated protein secondary structure estimation. Measurements reveal information regarding the secondary structure or backbone conformation of a protein. CD measurements can be used to determination the secondary structure content of a biomolecule to elucidate the relationship between structure and function or verify protein stability. The high throughput CD system with JASCO’s multivariate Secondary Structure Estimation (SSE) program can be used to quickly analyze CD data for routine quantitative research and quality control. A large number of samples can be automatically measured and efficiently analyzed using the High-Throughput CD (HTCD) system with Spectra Manager and multivariate SSE program.
The secondary structure of eight proteins are evaluated using the Multivariate SSE program.
Experimental
| Measurement conditions | |||
|---|---|---|---|
| Data acquisition interval | 0.1 nm | Response time | 2 seconds |
| Spectral bandwidth | 1 nm | Scan speed | 100 nm/min |
| Accumulations | 2 times | Path length | 1 mm |
Results
Prior to obtaining the sequence measurement, the pathlength and mean residue molar concentrations have to be specified so that the optical constants can be automatically calculated for the secondary structure estimation (Figure 1).
CD measurements in the far-UV region were obtained for eight 0.1 mg/mL protein samples with varying secondary structure compositions and are shown in Figure 2.
The secondary structure estimated using PLS multivariate analysis of the protein spectra are shown in Figure 1 . Table 1 compares these results with X-ray crystallography data. Figure 3 shows the secondary structure results from the JWMVS program.
Table 1. Comparison of Multivariate SSE results with X-ray crystallography data
| Helix (%) | Sheet (%) | Turn (%) | Other (%) | ||
| Lysozyme (Lyz) | PLS | 42.8 | 0.4 | 24.4 | 32.4 |
| X-ray | 41 | 4 | 19 | 35 | |
| Cytochrome C (CytC) | PLS | 42.6 | 3.1 | 18.1 | 36.2 |
| X-ray | 42 | 8 | 9 | 42 | |
| Concanavalin A (ConA) | PLS | 5.1 | 44.6 | 13.9 | 36.4 |
| X-ray | 2 | 36 | 12 | 49 | |
| β-Lactoglobulin | PLS | 17.8 | 35.5 | 12.3 | 34.4 |
| X-ray | 13 | 34 | 13 | 41 | |
| Trypsin Inhibitor | PLS | 13.9 | 25.3 | 17.3 | 43.5 |
| X-ray | 2 | 33 | 10 | 55 | |
| Ribonuclease A (RNaseA) | PLS | 21.5 | 14.7 | 22.4 | 41.4 |
| X-ray | 22 | 19 | 11 | 48 | |
| Human Serum Albumin (HSA) | PLS | 66.8 | 1.3 | 8.2 | 23.7 |
| X-ray | 72 | 0 | 8 | 20 | |
| Hemoglobin (Hb) | PLS | 61.1 | 0 | 18 | 20.9 |
| X-ray | 75 | 0 | 10 | 15 |
1 W. C. Johnson, Proteins: Structure, Function, and Genetics (1999), 35, 307-312.
2 PDB: Trypsin inhibitor: 1ba7 (DSSP), HAS: 1bm0 (DSSP)
Conclusion
This application note illustrates the use of the Multivariate SSE program to estimate secondary structure following CD measurement. The PLS method shows good agreement with secondary structure results obtained by X-ray crystallography.
Keywords
Protein secondary structure estimation, protein SSE, circular dichroism, high throughput circular dichrosim, high throughput CD, HTCD, Multivariate, Biochemistry, Pharmaceuticals, multiplate, 96 well plate