Lysozyme and N-acetyl Glucosamine Interaction Probed by Circular Dichroism
January 5, 2024
 Download This Application
Introduction
Change in the CD spectrum of the protein lysozyme directly reflect its change in structure. An example of the absorption derived from a protein’s peptide bonds can be seen at around 240nm. Measurement of a CD spectrum in the far-UV wavelength region can yield valuable information about a protein’s secondary structure. On the other hand, absorption due to aromatic amino acid side chain residues are seen in the wavelength region around 210-220 nm. There are additional absorption bands at wavelengths beyond 240 nm which do not overlap with the absorption band of the peptide bonds. For this reason, in order to study side chain residues, the CD spectrum is usually measured in the near UV region at wavelengths longer than 240 nm.
In this application note, the interaction between lysozyme and its inhibitor, N-acetyl-(D+)-glucosamine (NAG) was measured in the near-UV using a J-1500 CD spectrometer with ATS-530 automatic titrator.
Experimental
| Measurement conditions | |
|---|---|
| Data acquisition interval | 1 sec |
| Data pitch | 0.1 nm |
| Spectral bandwidth | 1 nm |
| Scan speed | 50 nm/min |
| Accumulations | 4 |
| Path length | 10 mm |
The titration of 225 mM NAG to 0.07 mM lysozyme solution was measured between 260-320 nm. NAG was slowly titrated in 50 µL increments at a constant temperature of 20°C.
Keywords
210-CD-0003, J-1500, lysozyme, Circular Dichroism, CD, near-UV, side chain residues, aromatics, ATS-530, automatic titrator, biochemistry
Results
The CD spectra of lysozyme, lysozyme + NAG, and NAG are shown in Figure 1. The lysozyme CD peaks are positive and observed at 293.5, 289, and 283.2 nm. The addition of NAG to lysozyme increases the CD intensity between 270nm and 300nm while the peaks in the CD spectrum of NAG only are barely observable.
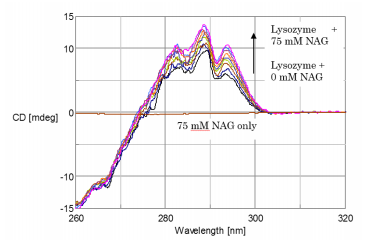
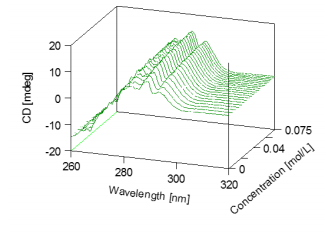
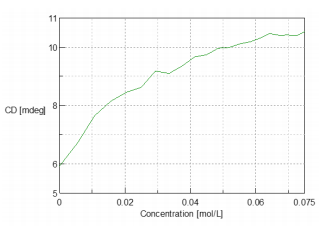
Figure 2 3D graphical representation of the changes in the CD spectra reflected by the titration of NAG into the lysozyme solution. Figure 3 illustrates the change in the CD intensity at 293.5 nm during the titration of lysozyme. X-ray crystallography data confirms that there is a tryptophan residues in the substrate bonding region of lysozyme. The X-ray data suggests that the CD data can be interpreted as increasing in CD intensity due to the interaction of NAG with lysozyme’s tryptophan residue.
By conducting this CD measurement, the change in the conformation of the enzyme’s side chains can be observed during interactions with the substrate and when the substrate bonding region is known, the type of side chain can be estimated using the obtained CD data.
Conclusion
This application note demonstrates the use of the J-1500 CD spectrometer and ATS-530 automatic titrator in probing the near-UV region of the CD spectrum in order to elucidate conformational changes in specific aromatic side chain residues of proteins.
Featured Products:
-
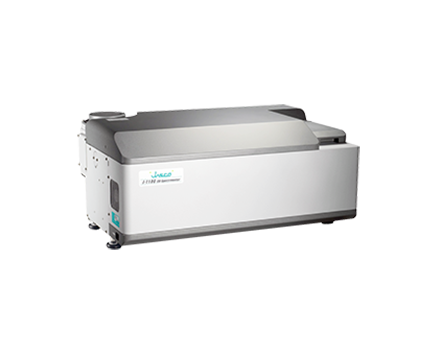
The basic, compact model for research, QA/QC, and teaching applications.
J-1100
-
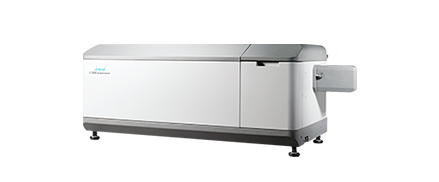
Highest performance with a wide range of accessories for maximum flexibility to meet complex research demands.
J-1500
-
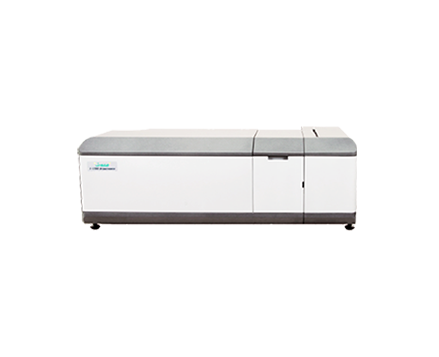
UV/Visible/NIR measurements up to 2,500 nm for MCD and specialized applications.
J-1700
-
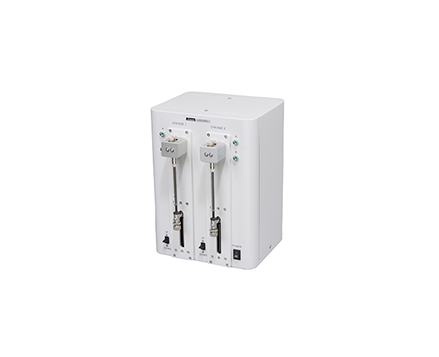
Automated Titration

Lysozyme and N-acetyl Glucosamine Interaction Probed by Circular Dichroism
Introduction
Change in the CD spectrum of the protein lysozyme directly reflect its change in structure. An example of the absorption derived from a protein’s peptide bonds can be seen at around 240nm. Measurement of a CD spectrum in the far-UV wavelength region can yield valuable information about a protein’s secondary structure. On the other hand, absorption due to aromatic amino acid side chain residues are seen in the wavelength region around 210-220 nm. There are additional absorption bands at wavelengths beyond 240 nm which do not overlap with the absorption band of the peptide bonds. For this reason, in order to study side chain residues, the CD spectrum is usually measured in the near UV region at wavelengths longer than 240 nm.
In this application note, the interaction between lysozyme and its inhibitor, N-acetyl-(D+)-glucosamine (NAG) was measured in the near-UV using a J-1500 CD spectrometer with ATS-530 automatic titrator.
Experimental
| Measurement conditions | |
|---|---|
| Data acquisition interval | 1 sec |
| Data pitch | 0.1 nm |
| Spectral bandwidth | 1 nm |
| Scan speed | 50 nm/min |
| Accumulations | 4 |
| Path length | 10 mm |
The titration of 225 mM NAG to 0.07 mM lysozyme solution was measured between 260-320 nm. NAG was slowly titrated in 50 µL increments at a constant temperature of 20°C.
Results
The CD spectra of lysozyme, lysozyme + NAG, and NAG are shown in Figure 1. The lysozyme CD peaks are positive and observed at 293.5, 289, and 283.2 nm. The addition of NAG to lysozyme increases the CD intensity between 270nm and 300nm while the peaks in the CD spectrum of NAG only are barely observable.
Figure 2 3D graphical representation of the changes in the CD spectra reflected by the titration of NAG into the lysozyme solution. Figure 3 illustrates the change in the CD intensity at 293.5 nm during the titration of lysozyme. X-ray crystallography data confirms that there is a tryptophan residues in the substrate bonding region of lysozyme. The X-ray data suggests that the CD data can be interpreted as increasing in CD intensity due to the interaction of NAG with lysozyme’s tryptophan residue.
By conducting this CD measurement, the change in the conformation of the enzyme’s side chains can be observed during interactions with the substrate and when the substrate bonding region is known, the type of side chain can be estimated using the obtained CD data.
Conclusion
This application note demonstrates the use of the J-1500 CD spectrometer and ATS-530 automatic titrator in probing the near-UV region of the CD spectrum in order to elucidate conformational changes in specific aromatic side chain residues of proteins.
Keywords
210-CD-0003, J-1500, lysozyme, Circular Dichroism, CD, near-UV, side chain residues, aromatics, ATS-530, automatic titrator, biochemistry