MCR Chemometric Modeling for FTIR Imaging Microscopy
January 5, 2024
 Download This Application
Introduction
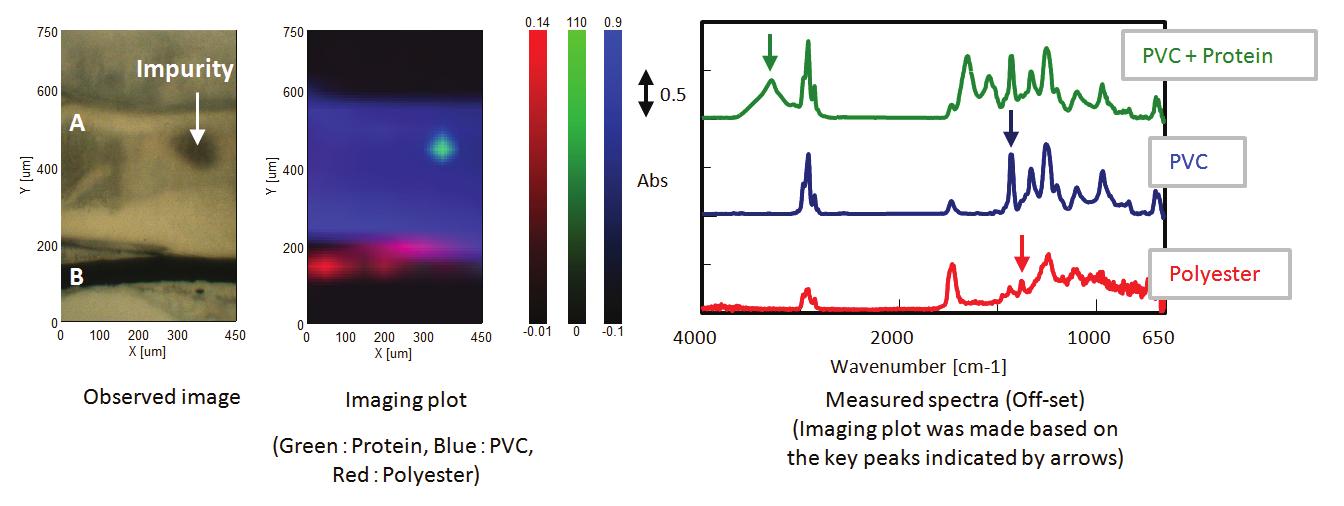
Imaging measurements using FTIR microscopy are widely used to visualize the distribution of components in a sample matrix. In recent years, the variety of imaging methods has increased due to the rapid development of high-speed imaging techniques using multi-channel detectors and IR microscopes. Therefore, it has become possible to select an appropriate imaging method according to the application. Analysis of the enormous amounts of data from imaging measurement can require significant time and special skills. For example, Figure 1 displays the imaging analysis results for a multilayer film. It can be seen that the spectrum for each component has been selected and the intensity distribution of the key peaks are shown as the color-coded image.
From the spectra, it can be observed that three components are present in the film, and from the images, the distribution is as follows: polyvinyl chloride (PVC) is found in layer A and polyester, in layer B of the multilayer film and that protein is present as an impurity in the PVC layer.
As described above, the distribution of components can easily be discerned by analyzing the imaging data. On the other hand, it is possible that as the quantity of data increases some components in the sample may be missed.
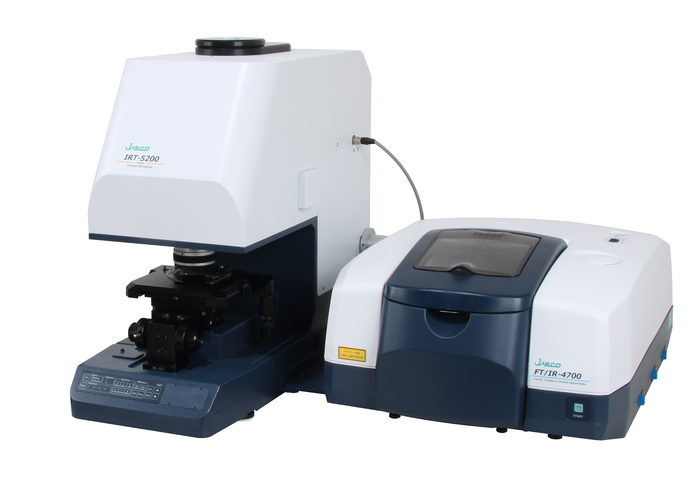
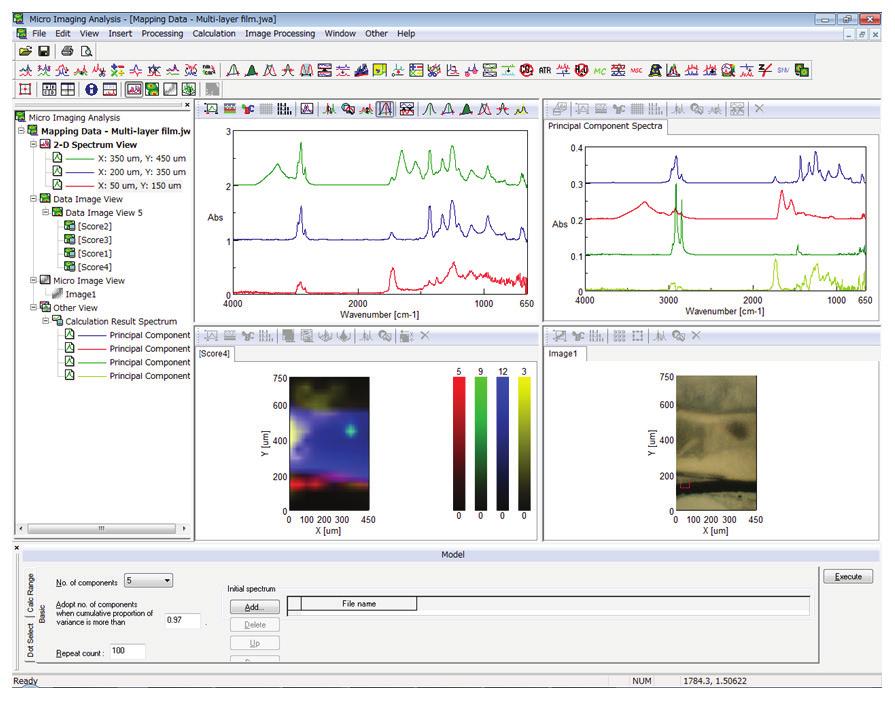
This application note provides an example of imaging data analysis using “MCR Model Analysis” in the newly developed Micro Imaging Analysis program for the IRT-5000/7000 series FT/IR microscopes (shown in Figure 2). MCR Model Analysis is a function which assists analysis in the Micro Imaging Analysis program making it possible to create a sample image without Verifying each spectrum in the matrix.
Experimental
Model Analysis
MCR Model Analysis creates a relative concentration distribution by extracting the principal components automatically from the measured spectra. Therefore, the imaging plot can be obtained in a very short time without risk of neglecting any components contained in the sample. It is also possible to identify the components by searching the spectra of the principal components against a spectral database.
Keywords
100-SO-0238
Results
MCR Model Analysis Results
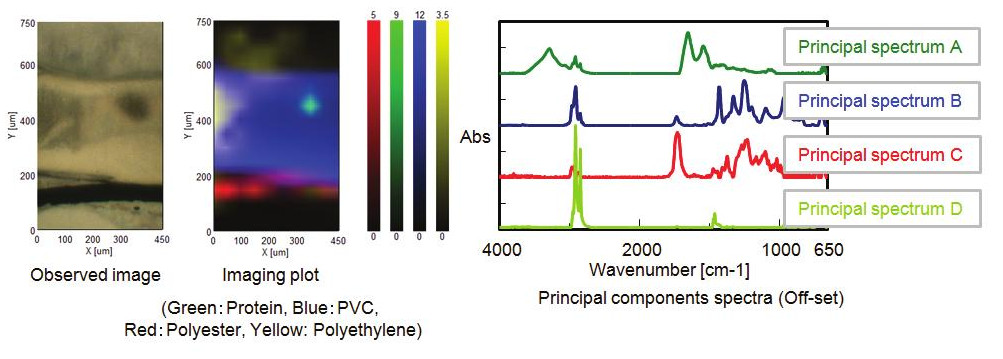
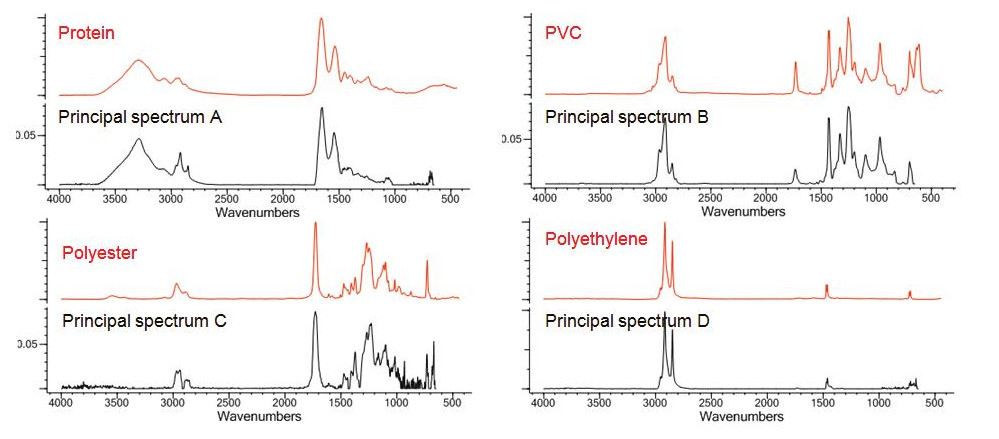
Figure 3 shows the imaging analysis result of a multilayer film using the MCR Model Analysis software. Comparing the data in Figure 1 with the data in Figure 3, two differences can be observed. The first is that the spectrum of the fourth component was contained in the spectrum of another primary component. It indicates that a component possibly ignored by Imaging Analysis using key bands can be accurately analyzed by using MCR Model Analysis. The second is the difference in the impurity spectra. The pure spectrum of the protein as an impurity can be obtained using MCR Model Analysis, while the overlapped spectra of protein and PVC in the multilayer were obtained as the measured spectrum by the method using key bands. The spectrum of the pure component improves the accuracy for searching databases and facilitates the identification of the components. Figure 4 illustrates the database search result of the principal components. Polyethylene was found as a principal component which was neglected by the Imaging analysis using key peaks.
As described above, the MCR Model Analysis makes it possible to obtain an imaging plot of all contained principal components without selecting a spectrum, which improves the results of database searches.
System configuration
P/N: 7084-J002A
P/N: 7081-J051A
FT/IR-4600 FT/IR Spectrometer
IRT-5200-16 Infrared Microscope
Micro Imaging Analysis Program (Standard for IRT-5200/7100/7200)
Featured Products:
-

Compact fixed range mid-IR spectrometer with options to extend to the NIR/FIR
FT/IR-4X
-
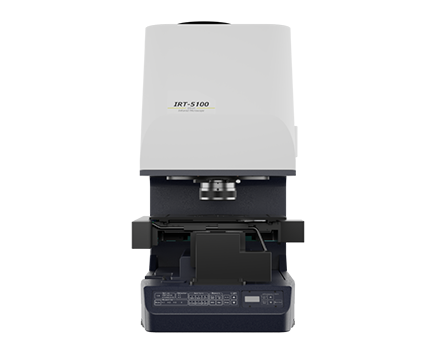
The IRT-5000 is an innovative FTIR microscope with powerful sample identification and imaging.
IRT-5000 Series FTIR Microscopes

MCR Chemometric Modeling for FTIR Imaging Microscopy
Introduction
Imaging measurements using FTIR microscopy are widely used to visualize the distribution of components in a sample matrix. In recent years, the variety of imaging methods has increased due to the rapid development of high-speed imaging techniques using multi-channel detectors and IR microscopes. Therefore, it has become possible to select an appropriate imaging method according to the application. Analysis of the enormous amounts of data from imaging measurement can require significant time and special skills. For example, Figure 1 displays the imaging analysis results for a multilayer film. It can be seen that the spectrum for each component has been selected and the intensity distribution of the key peaks are shown as the color-coded image.
From the spectra, it can be observed that three components are present in the film, and from the images, the distribution is as follows: polyvinyl chloride (PVC) is found in layer A and polyester, in layer B of the multilayer film and that protein is present as an impurity in the PVC layer.
As described above, the distribution of components can easily be discerned by analyzing the imaging data. On the other hand, it is possible that as the quantity of data increases some components in the sample may be missed.
This application note provides an example of imaging data analysis using “MCR Model Analysis” in the newly developed Micro Imaging Analysis program for the IRT-5000/7000 series FT/IR microscopes (shown in Figure 2). MCR Model Analysis is a function which assists analysis in the Micro Imaging Analysis program making it possible to create a sample image without Verifying each spectrum in the matrix.
Experimental
Model Analysis
MCR Model Analysis creates a relative concentration distribution by extracting the principal components automatically from the measured spectra. Therefore, the imaging plot can be obtained in a very short time without risk of neglecting any components contained in the sample. It is also possible to identify the components by searching the spectra of the principal components against a spectral database.
Results
MCR Model Analysis Results
Figure 3 shows the imaging analysis result of a multilayer film using the MCR Model Analysis software. Comparing the data in Figure 1 with the data in Figure 3, two differences can be observed. The first is that the spectrum of the fourth component was contained in the spectrum of another primary component. It indicates that a component possibly ignored by Imaging Analysis using key bands can be accurately analyzed by using MCR Model Analysis. The second is the difference in the impurity spectra. The pure spectrum of the protein as an impurity can be obtained using MCR Model Analysis, while the overlapped spectra of protein and PVC in the multilayer were obtained as the measured spectrum by the method using key bands. The spectrum of the pure component improves the accuracy for searching databases and facilitates the identification of the components. Figure 4 illustrates the database search result of the principal components. Polyethylene was found as a principal component which was neglected by the Imaging analysis using key peaks.
As described above, the MCR Model Analysis makes it possible to obtain an imaging plot of all contained principal components without selecting a spectrum, which improves the results of database searches.
System configuration
P/N: 7084-J002A
P/N: 7081-J051A
FT/IR-4600 FT/IR Spectrometer
IRT-5200-16 Infrared Microscope
Micro Imaging Analysis Program (Standard for IRT-5200/7100/7200)
Keywords
100-SO-0238