Measurement Accuracy of the TCH-703 8-Position Turret Micro Cell Holder
January 5, 2024
Introduction
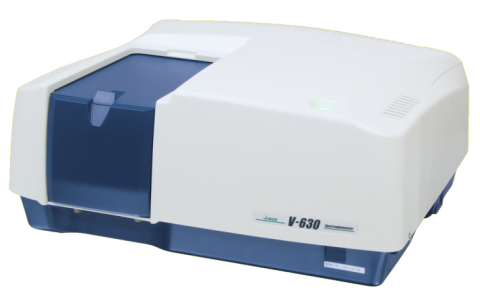
UV-Visible Spectrophotometer
The TCH-703 eight-position turret micro cell accessory provides easy and reliable UV-Visible measurements of up to eight samples with volumes as small as 4 microliters, useful for samples of limited quantities. To obtain measurements, the samples are pipetted onto the removable sample turret which is then set into the cell holder. A knob moves the desired sample into the path of the incoming light beam, shown below:

This application note demonstrates the measurement accuracy and reproducibility of the turret micro cell holder by measuring a DNA sample.
Keywords
260-UV-0004, V-630, UV-Visible/NIR, DNA, microvolume, TCH-703 8-position Microcell Holder, μWash MW-2000 micro-cell washing accessory, Biochemistry
Results
To verify the measurement accuracy of the turret cells, analysis of the DNA samples of raw bovine thymus was performed in the 8 cells at specific concentrations. The DNA concentrations were measured using the Warburg-Christian method. The cross validation errors (C.V.) for these measurements were 2% with a DNA concentration of 50 μg/mL, 11% for 10 μg/mL, and 10% for 5 μg/mL.
To analyze the reproducibility of the turret rotation, the variation in the quantitative measurements of the same samples in the cell were measured while the turret was rotated. The CV for these measurements was 0.3% for 50 μg/mL DNA, 1.7% for 10 μg/mL, and 3.5% for 5 μg/mL (Tables 1-3).
Table 1. Cell measurement accuracy and turret rotation reproducibility using 50 μg/mL of DNA.
| 1st | 2nd | 3rd | Average | S.D. | C.V. | |
| Cell 1 | 42.00 | 41.90 | 42.00 | 41.97 | 0.058 | 0.14 |
| Cell 2 | 39.70 | 39.80 | 39.80 | 39.77 | 0.058 | 0.15 |
| Cell 3 | 41.30 | 41.50 | 41.70 | 41.50 | 0.200 | 0.48 |
| Cell 4 | 41.00 | 41.00 | 40.90 | 40.97 | 0.058 | 0.14 |
| Cell 5 | 40.90 | 41.00 | 41.00 | 40.97 | 0.058 | 0.14 |
| Cell 6 | 41.80 | 41.80 | 42.50 | 42.03 | 0.404 | 0.96 |
| Cell 7 | 41.90 | 42.00 | 41.90 | 41.93 | 0.058 | 0.14 |
| Cell 8 | 41.90 | 41.90 | 42.00 | 41.93 | 0.058 | 0.14 |
| Average | 41.31 | 41.36 | 41.48 | 41.38 | ||
| S.D. | 0.781 | 0.746 | 0.861 | 0.765 | ||
| C.V. | 1.89 | 1.80 | 2.80 | 1.85 |
Table 2. Cell measurement accuracy and turret rotation reproducibility using 10 μg/mL of DNA.
| 1st | 2nd | 3rd | Average | S.D. | C.V. | |
| Cell 1 | 8.3 | 8.3 | 8.6 | 8.40 | 0.173 | 2.06 |
| Cell 2 | 8.2 | 8.2 | 9.3 | 8.57 | 0.635 | 7.41 |
| Cell 3 | 11.0 | 11.1 | 10.9 | 11.00 | 0.100 | 0.91 |
| Cell 4 | 8.4 | 8.3 | 8.5 | 8.40 | 0.100 | 1.19 |
| Cell 5 | 9.4 | 9.5 | 9.4 | 9.43 | 0.058 | 0.61 |
| Cell 6 | 8.2 | 8.3 | 8.2 | 8.23 | 0.058 | 0.70 |
| Cell 7 | 10.3 | 10.3 | 10.3 | 10.30 | 0.000 | 0.00 |
| Cell 8 | 9.6 | 9.5 | 9.5 | 9.53 | 0.058 | 0.61 |
| Average | 9.18 | 9.19 | 9.34 | 9.23 | ||
| S.D. | 1.078 | 1.097 | 0.921 | 0.991 | ||
| C.V. | 11.72 | 11.94 | 9.86 | 10.73 |
Table 3. Cell measurement accuracy and turret rotation reproducibility using 5 μg/mL of DNA.
| 1st | 2nd | 3rd | Average | S.D. | C.V. | |
| Cell 1 | 4.2 | 4.4 | 4.5 | 4.37 | 0.153 | 3.50 |
| Cell 2 | 3.4 | 3.5 | 3.5 | 3.47 | 0.058 | 1.67 |
| Cell 3 | 3.8 | 3.9 | 4.6 | 4.10 | 0.436 | 10.63 |
| Cell 4 | 3.7 | 3.9 | 3.8 | 3.80 | 0.100 | 2.63 |
| Cell 5 | 3.3 | 3.6 | 3.6 | 3.50 | 0.173 | 4.95 |
| Cell 6 | 3.2 | 3.3 | 3.3 | 3.27 | 0.058 | 1.77 |
| Cell 7 | 3.5 | 3.6 | 3.6 | 3.57 | 0.058 | 1.62 |
| Cell 8 | 3.7 | 3.8 | 3.8 | 3.77 | 0.058 | 1.53 |
| Average | 3.60 | 3.75 | 3.84 | 3.73 | ||
| S.D. | 0.321 | 0.334 | 0.469 | 0.377 | ||
| C.V. | 8.91 | 8.90 | 12.22 | 10.11 |
The concentrations results determined by UV-Visible measurements in the 8-position turret cell were used to create a calibration curve. Figure 1 shows the UV-Visible determined concentrations as a function of the sample concentration. This calibration curve was used to determine a detection limit of 0.38 μg/mL and a determination limit of 6.4 μg/mL.
Here we define the detection limit as the concentration calculated from the calibration curve when the maximum quantitative value of the 95% confidence interval is at a calculated concentration of 0 μg/mL. The determination limit is defined as the concentration calculated from the calibration curve using some specific quantitative results that has a coefficient of variation of 10%.
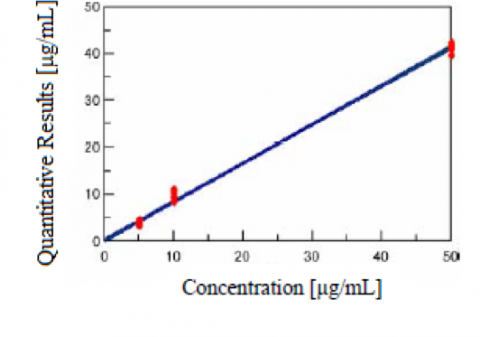
The equation for the fitting line is:
y = 0.824697 ± 0.010735 x E + 0.236037 ± 0.311315
The correlation coefficient is 0.998451 and the standard error is 1.12974.
Loading and cleaning the 8-position turret cell holder is just as easy as acquiring the measurements. A round-shaped gel loading tip is most appropriate for loading samples into the turret cells since this pipette tip prevents air bubbles in the cells.
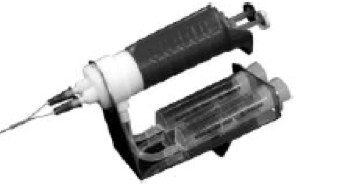
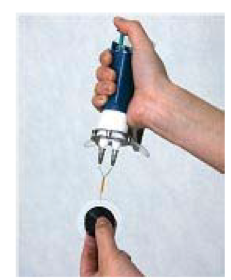
To remove protein and biological samples from the cells, commercial detergents for instrument cuvettes can be used. If the turret cells are heavily contaminated, a concentrated nitric acid solution can also be used. JASCO offers a washing device, the μWash, which is designed to clean the cell easily using water, methanol, ethanol, and other solvents. The needle tip of the μWash is inserted into the cell and the syringe button is pressed several times to clean the turret cells by filling and draining them with small quantities of a washing solution.
Featured Products:
-
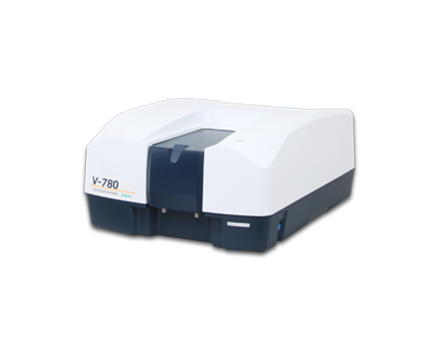
A high sensitivity UV-Visible/NIR Spectrophotometer with InGaAs detector for wavelengths up to1600nm
V-780 UV-Visible/NIR Spectrophotometer
-
UV-Visible/NIR Spectra Manager™
-
V-730 UV-Visible Spectrophotometer

Measurement Accuracy of the TCH-703 8-Position Turret Micro Cell Holder
Introduction

UV-Visible Spectrophotometer
The TCH-703 eight-position turret micro cell accessory provides easy and reliable UV-Visible measurements of up to eight samples with volumes as small as 4 microliters, useful for samples of limited quantities. To obtain measurements, the samples are pipetted onto the removable sample turret which is then set into the cell holder. A knob moves the desired sample into the path of the incoming light beam, shown below:

This application note demonstrates the measurement accuracy and reproducibility of the turret micro cell holder by measuring a DNA sample.
Results
To verify the measurement accuracy of the turret cells, analysis of the DNA samples of raw bovine thymus was performed in the 8 cells at specific concentrations. The DNA concentrations were measured using the Warburg-Christian method. The cross validation errors (C.V.) for these measurements were 2% with a DNA concentration of 50 μg/mL, 11% for 10 μg/mL, and 10% for 5 μg/mL.
To analyze the reproducibility of the turret rotation, the variation in the quantitative measurements of the same samples in the cell were measured while the turret was rotated. The CV for these measurements was 0.3% for 50 μg/mL DNA, 1.7% for 10 μg/mL, and 3.5% for 5 μg/mL (Tables 1-3).
Table 1. Cell measurement accuracy and turret rotation reproducibility using 50 μg/mL of DNA.
| 1st | 2nd | 3rd | Average | S.D. | C.V. | |
| Cell 1 | 42.00 | 41.90 | 42.00 | 41.97 | 0.058 | 0.14 |
| Cell 2 | 39.70 | 39.80 | 39.80 | 39.77 | 0.058 | 0.15 |
| Cell 3 | 41.30 | 41.50 | 41.70 | 41.50 | 0.200 | 0.48 |
| Cell 4 | 41.00 | 41.00 | 40.90 | 40.97 | 0.058 | 0.14 |
| Cell 5 | 40.90 | 41.00 | 41.00 | 40.97 | 0.058 | 0.14 |
| Cell 6 | 41.80 | 41.80 | 42.50 | 42.03 | 0.404 | 0.96 |
| Cell 7 | 41.90 | 42.00 | 41.90 | 41.93 | 0.058 | 0.14 |
| Cell 8 | 41.90 | 41.90 | 42.00 | 41.93 | 0.058 | 0.14 |
| Average | 41.31 | 41.36 | 41.48 | 41.38 | ||
| S.D. | 0.781 | 0.746 | 0.861 | 0.765 | ||
| C.V. | 1.89 | 1.80 | 2.80 | 1.85 |
Table 2. Cell measurement accuracy and turret rotation reproducibility using 10 μg/mL of DNA.
| 1st | 2nd | 3rd | Average | S.D. | C.V. | |
| Cell 1 | 8.3 | 8.3 | 8.6 | 8.40 | 0.173 | 2.06 |
| Cell 2 | 8.2 | 8.2 | 9.3 | 8.57 | 0.635 | 7.41 |
| Cell 3 | 11.0 | 11.1 | 10.9 | 11.00 | 0.100 | 0.91 |
| Cell 4 | 8.4 | 8.3 | 8.5 | 8.40 | 0.100 | 1.19 |
| Cell 5 | 9.4 | 9.5 | 9.4 | 9.43 | 0.058 | 0.61 |
| Cell 6 | 8.2 | 8.3 | 8.2 | 8.23 | 0.058 | 0.70 |
| Cell 7 | 10.3 | 10.3 | 10.3 | 10.30 | 0.000 | 0.00 |
| Cell 8 | 9.6 | 9.5 | 9.5 | 9.53 | 0.058 | 0.61 |
| Average | 9.18 | 9.19 | 9.34 | 9.23 | ||
| S.D. | 1.078 | 1.097 | 0.921 | 0.991 | ||
| C.V. | 11.72 | 11.94 | 9.86 | 10.73 |
Table 3. Cell measurement accuracy and turret rotation reproducibility using 5 μg/mL of DNA.
| 1st | 2nd | 3rd | Average | S.D. | C.V. | |
| Cell 1 | 4.2 | 4.4 | 4.5 | 4.37 | 0.153 | 3.50 |
| Cell 2 | 3.4 | 3.5 | 3.5 | 3.47 | 0.058 | 1.67 |
| Cell 3 | 3.8 | 3.9 | 4.6 | 4.10 | 0.436 | 10.63 |
| Cell 4 | 3.7 | 3.9 | 3.8 | 3.80 | 0.100 | 2.63 |
| Cell 5 | 3.3 | 3.6 | 3.6 | 3.50 | 0.173 | 4.95 |
| Cell 6 | 3.2 | 3.3 | 3.3 | 3.27 | 0.058 | 1.77 |
| Cell 7 | 3.5 | 3.6 | 3.6 | 3.57 | 0.058 | 1.62 |
| Cell 8 | 3.7 | 3.8 | 3.8 | 3.77 | 0.058 | 1.53 |
| Average | 3.60 | 3.75 | 3.84 | 3.73 | ||
| S.D. | 0.321 | 0.334 | 0.469 | 0.377 | ||
| C.V. | 8.91 | 8.90 | 12.22 | 10.11 |
The concentrations results determined by UV-Visible measurements in the 8-position turret cell were used to create a calibration curve. Figure 1 shows the UV-Visible determined concentrations as a function of the sample concentration. This calibration curve was used to determine a detection limit of 0.38 μg/mL and a determination limit of 6.4 μg/mL.
Here we define the detection limit as the concentration calculated from the calibration curve when the maximum quantitative value of the 95% confidence interval is at a calculated concentration of 0 μg/mL. The determination limit is defined as the concentration calculated from the calibration curve using some specific quantitative results that has a coefficient of variation of 10%.

The equation for the fitting line is:
y = 0.824697 ± 0.010735 x E + 0.236037 ± 0.311315
The correlation coefficient is 0.998451 and the standard error is 1.12974.
Loading and cleaning the 8-position turret cell holder is just as easy as acquiring the measurements. A round-shaped gel loading tip is most appropriate for loading samples into the turret cells since this pipette tip prevents air bubbles in the cells.
To remove protein and biological samples from the cells, commercial detergents for instrument cuvettes can be used. If the turret cells are heavily contaminated, a concentrated nitric acid solution can also be used. JASCO offers a washing device, the μWash, which is designed to clean the cell easily using water, methanol, ethanol, and other solvents. The needle tip of the μWash is inserted into the cell and the syringe button is pressed several times to clean the turret cells by filling and draining them with small quantities of a washing solution.


Keywords
260-UV-0004, V-630, UV-Visible/NIR, DNA, microvolume, TCH-703 8-position Microcell Holder, μWash MW-2000 micro-cell washing accessory, Biochemistry

 Download This Application