Measurement Reproducibility of a Short Pathlength Cell using the High-Throughput Circular Dichroism System
August 15, 2022
 Download This Application
Introduction
The evaluation of secondary and tertiary structure is important in the quality testing of protein and peptide based biologics. CD’s sensitivity to a biomolecule’s asymmetry is ideal for pharmaceutical stability and processing studies, where even slight changes to the molecule or its environment can induce structural changes, altering its function. While CD measurements are known to be quick and easy, the high-throughput system dramatically increases the amount of data obtained with automated measurements from two, 96-well microplates.
Since CD is an absorption technique based on Beer’s Law, the sample concentration and pathlength are critical to obtaining good CD data. Strongly absorbing samples and/or buffers can be measured by either decreasing the concentration or cell pathlength. However, for some samples, the working concentration cannot be modified. The 0.2 mm pathlength cell allows for strongly absorbing samples to be accurately and reproducibly measured in the far-UV with the high-throughput CD system.
This application note demonstrates the measurement reproducibility of the 0.2 mm pathlength cell using the HTCD system.
Experimental
| Measurement Conditions | |||
| Data Pitch | 0.1 nm | D.I.T. | 4 sec |
| Bandwidth | 1 nm | Scanning Speed | 100 nm/min |
| Accumulations | 3 | Concentration | 0.5 mg/mL |
| Syringe Pump Settings | Wash Settings | ||
| 1st Air Volume | 200 µL | Wash 1 | 200 µL x 2 times (0.5% detergent) |
| Sample Volume | 100 µL | Wash 2 | 200 µL x 2 times (Water) |
| Waiting Time | 5 sec | Wash 3 | 300 µL x 2 times (Ethanol) |
| Syringe Speed for Load/Drain | Medium | Dry Time | 120 sec |
| Syringe Speed for Flush | Medium | ||
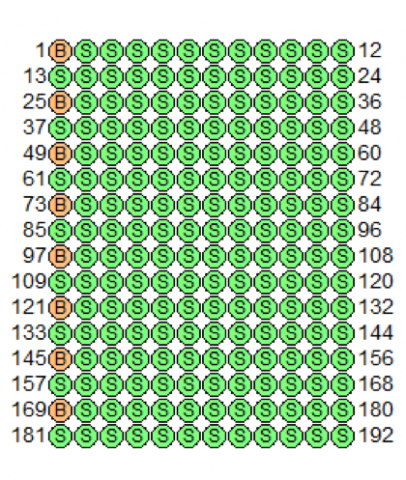
184 aliquots of a 0.5 mg/mL BSA (bovine serum albumin) solution were distributed in the sample wells marked by the green S in Figure 1. The orange B’s designate the wells used to obtain baseline measurements of water.
Keywords
High-throughput Circular Dichroism (HTCD), Pharmaceuticals, Biochemistry
Results
The far-UV CD spectra of the 184 BSA samples are shown in Figure 2. Tables 1-3 illustrate the measurement reproducibility of the HTCD system at 192.5, 208, and 210 nm, using a 0.2 mm pathlength cell.
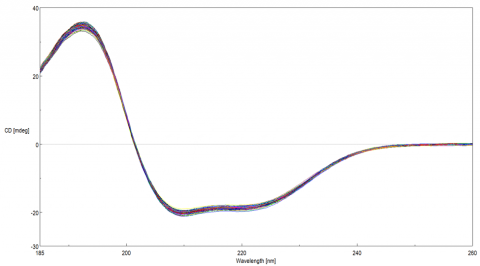
Table 1. HTCD measurement reproducibility at 192.5 nm.
| Samples | 1-23 | 24-46 | 47-69 | 70-92 | 93-115 | 116-138 | 139-161 | 162-184 | 1-184 |
| Average | 34.60357 | 34.741 | 34.52855 | 34.11767 | 34.50529 | 34.1459 | 34.50052 | 34.5547 | 34.58715 |
| Maximum | 35.2961 | 35.7233 | 34.0444 | 35.0716 | 35.2649 | 35.8348 | 35.7714 | 35.1974 | 35.8348 |
| Minimum | 33.443 | 33.5198 | 33.9521 | 33.1163 | 33.7889 | 33.983 | 33.3085 | 32.4659 | 32.4659 |
| S.D. | 0.416472 | 0.44273 | 0.328491 | 0.418049 | 0.406204 | 0.418935 | 0.467622 | 0.535832 | 0.502431 |
| RSD | 0.012036 | 0.012744 | 0.009514 | 0.012253 | 0.011772 | 0.01192 | 0.013554 | 0.015507 | 0.014527 |
Table 2. HTCD measurement reproducibility at 208 nm.
| Samples | 1-23 | 24-46 | 47-69 | 70-92 | 93-115 | 116-138 | 139-161 | 162-184 | 1-184 |
| Average | -19.26734 | -19.21747 | -19.44108 | -19.75571 | -19.63827 | -19.31892 | -19.36812 | -19.26523 | -19.40902 |
| Maximum | -18.9835 | -18.4109 | -19.204 | -19.1672 | -19.1612 | -18.8735 | -18.6892 | -18.1287 | -18.1287 |
| Minimum | -19.4804 | -19.7724 | -20.1067 | -20.4039 | -20.3477 | -19.8898 | -19.7292 | -.196747 | -20.4039 |
| S.D. | 0.136446 | 0.245101 | 0.20623 | 0.356229 | 0.225121 | 0.233698 | 0.238288 | 0.322388 | 0.307592 |
| RSD | -0.007082 | -0.012754 | -0.010608 | -0.018032 | -0.011463 | -0.012097 | -0.012303 | -0.016734 | -0.015848 |
Table 3. HTCD measurement reproducibility at 210 nm.
| Samples | 1-23 | 24-46 | 47-69 | 70-92 | 93-115 | 116-138 | 139-161 | 162-184 | 1-184 |
| Average | -19.98659 | -19.87717 | -20.09943 | -20.48393 | -20.33072 | -20.00834 | -20.16703 | -19.97124 | -20.11556 |
| Maximum | -19.7322 | -19.0526 | -19.8503 | -19.9427 | -19.8844 | -19.497 | -19.5355 | -18.7035 | -18.7035 |
| Minimum | -20.2018 | -20.4108 | -20.6848 | -21.248 | -21.0578 | -21.05693 | -20.6122 | -20.3677 | -21.248 |
| S.D. | 0.12906 | 0.262219 | 0.193207 | 0.342251 | 0.229245 | 0.24014 | 0.267663 | 0.348132 | 0.319071 |
| RSD | -0.006457 | -0.01319 | -0.009613 | -0.016708 | -0.011276 | -0.01200 | -0.013272 | -0.017432 | -0.015862 |
Featured Products:
-
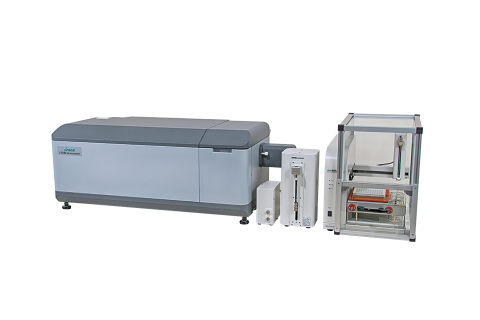
Automated HTCD
-
Automated high-throughput screening system for use with the J-1500/1700.
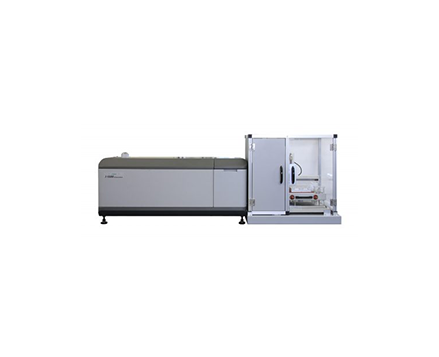
High-Throughput CD
-
Highest performance with a wide range of accessories for maximum flexibility to meet complex research demands.
J-1500

Measurement Reproducibility of a Short Pathlength Cell using the High-Throughput Circular Dichroism System
Introduction
The evaluation of secondary and tertiary structure is important in the quality testing of protein and peptide based biologics. CD’s sensitivity to a biomolecule’s asymmetry is ideal for pharmaceutical stability and processing studies, where even slight changes to the molecule or its environment can induce structural changes, altering its function. While CD measurements are known to be quick and easy, the high-throughput system dramatically increases the amount of data obtained with automated measurements from two, 96-well microplates.
Since CD is an absorption technique based on Beer’s Law, the sample concentration and pathlength are critical to obtaining good CD data. Strongly absorbing samples and/or buffers can be measured by either decreasing the concentration or cell pathlength. However, for some samples, the working concentration cannot be modified. The 0.2 mm pathlength cell allows for strongly absorbing samples to be accurately and reproducibly measured in the far-UV with the high-throughput CD system.
This application note demonstrates the measurement reproducibility of the 0.2 mm pathlength cell using the HTCD system.
Experimental
| Measurement Conditions | |||
| Data Pitch | 0.1 nm | D.I.T. | 4 sec |
| Bandwidth | 1 nm | Scanning Speed | 100 nm/min |
| Accumulations | 3 | Concentration | 0.5 mg/mL |
| Syringe Pump Settings | Wash Settings | ||
| 1st Air Volume | 200 µL | Wash 1 | 200 µL x 2 times (0.5% detergent) |
| Sample Volume | 100 µL | Wash 2 | 200 µL x 2 times (Water) |
| Waiting Time | 5 sec | Wash 3 | 300 µL x 2 times (Ethanol) |
| Syringe Speed for Load/Drain | Medium | Dry Time | 120 sec |
| Syringe Speed for Flush | Medium | ||
184 aliquots of a 0.5 mg/mL BSA (bovine serum albumin) solution were distributed in the sample wells marked by the green S in Figure 1. The orange B’s designate the wells used to obtain baseline measurements of water.
Results
The far-UV CD spectra of the 184 BSA samples are shown in Figure 2. Tables 1-3 illustrate the measurement reproducibility of the HTCD system at 192.5, 208, and 210 nm, using a 0.2 mm pathlength cell.
Table 1. HTCD measurement reproducibility at 192.5 nm.
| Samples | 1-23 | 24-46 | 47-69 | 70-92 | 93-115 | 116-138 | 139-161 | 162-184 | 1-184 |
| Average | 34.60357 | 34.741 | 34.52855 | 34.11767 | 34.50529 | 34.1459 | 34.50052 | 34.5547 | 34.58715 |
| Maximum | 35.2961 | 35.7233 | 34.0444 | 35.0716 | 35.2649 | 35.8348 | 35.7714 | 35.1974 | 35.8348 |
| Minimum | 33.443 | 33.5198 | 33.9521 | 33.1163 | 33.7889 | 33.983 | 33.3085 | 32.4659 | 32.4659 |
| S.D. | 0.416472 | 0.44273 | 0.328491 | 0.418049 | 0.406204 | 0.418935 | 0.467622 | 0.535832 | 0.502431 |
| RSD | 0.012036 | 0.012744 | 0.009514 | 0.012253 | 0.011772 | 0.01192 | 0.013554 | 0.015507 | 0.014527 |
Table 2. HTCD measurement reproducibility at 208 nm.
| Samples | 1-23 | 24-46 | 47-69 | 70-92 | 93-115 | 116-138 | 139-161 | 162-184 | 1-184 |
| Average | -19.26734 | -19.21747 | -19.44108 | -19.75571 | -19.63827 | -19.31892 | -19.36812 | -19.26523 | -19.40902 |
| Maximum | -18.9835 | -18.4109 | -19.204 | -19.1672 | -19.1612 | -18.8735 | -18.6892 | -18.1287 | -18.1287 |
| Minimum | -19.4804 | -19.7724 | -20.1067 | -20.4039 | -20.3477 | -19.8898 | -19.7292 | -.196747 | -20.4039 |
| S.D. | 0.136446 | 0.245101 | 0.20623 | 0.356229 | 0.225121 | 0.233698 | 0.238288 | 0.322388 | 0.307592 |
| RSD | -0.007082 | -0.012754 | -0.010608 | -0.018032 | -0.011463 | -0.012097 | -0.012303 | -0.016734 | -0.015848 |
Table 3. HTCD measurement reproducibility at 210 nm.
| Samples | 1-23 | 24-46 | 47-69 | 70-92 | 93-115 | 116-138 | 139-161 | 162-184 | 1-184 |
| Average | -19.98659 | -19.87717 | -20.09943 | -20.48393 | -20.33072 | -20.00834 | -20.16703 | -19.97124 | -20.11556 |
| Maximum | -19.7322 | -19.0526 | -19.8503 | -19.9427 | -19.8844 | -19.497 | -19.5355 | -18.7035 | -18.7035 |
| Minimum | -20.2018 | -20.4108 | -20.6848 | -21.248 | -21.0578 | -21.05693 | -20.6122 | -20.3677 | -21.248 |
| S.D. | 0.12906 | 0.262219 | 0.193207 | 0.342251 | 0.229245 | 0.24014 | 0.267663 | 0.348132 | 0.319071 |
| RSD | -0.006457 | -0.01319 | -0.009613 | -0.016708 | -0.011276 | -0.01200 | -0.013272 | -0.017432 | -0.015862 |
Keywords
High-throughput Circular Dichroism (HTCD), Pharmaceuticals, Biochemistry