Microscale Samples: Measurement of Hemoglobin and DNA Derived from Bovine Thymus
January 5, 2024
 Download This Application
Introduction
Circular dichroism is an essential tool for the structural analysis of biological molecules such as proteins and nucleic acids. The typical path length of cells used for CD measurements is 1 mm, which makes it possible to measure sample volumes around 400 µL and concentrations as low as 0.1 mg/mL. However, there are many instances in which the sample size is even more limited.
The enhanced sensitivity of the J-1500 CD spectrometer enables CD spectra to be obtained with high accuracy and high signal-to-noise (S/N) ratio, even at microscale sizes, using a newly developed microcell with a small surface area.
In this application note, CD spectra of hemoglobin and DNA derived from bovine thymus are measured using a microsampling disc with the J-1500 CD spectrometer. The measurements were performed with a 3 µL sample volume to demonstrate the sensitivity of the J-1500 with small sample volumes in a microcell.
Experimental
| Measurement conditions J-1500 CD spectrometer, microsampling disc, cylindrical cell | |
|---|---|
| Spectral bandwidth | 1 nm |
| Accumulation | 10 times |
| Data acquisition interval | 0.1 nm |
| Sample concentration | 0.5 mg/mL |
| Scan speed | 100 nm/min |
| Response time | 2 sec |
| Path length | 0.2 mm |
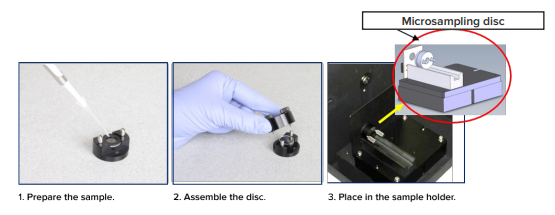
To use the microsampling disc shown in Figure 1, the sample is dropped onto the central part of the disc. The disc is then assembled and the sample is retained in the optical axis of the disk. The disk is then placed in a vertical position in the sample holder.
Keywords
260-CD-0019, Microassay, microsampling disc, microcell, Circular Dichroism, CD, hemoglobin, DNA, bovine thymus, secondary structure, J-1500
Results
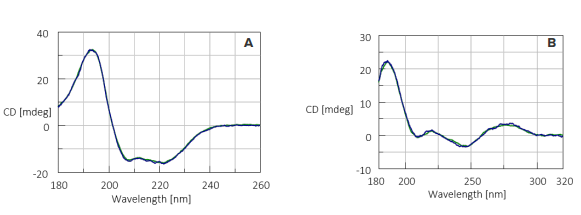
CD spectra of hemoglobin and DNA derived from bovine thymus using the microsampling disc and a standard cylindrical cell are shown in Figure 2. The microsampling disc (green line) provided near identical spectra compared to the cylindrical cell (blue line) used. The low-noise CD spectra shown have high signal-to-noise ratios and data was obtained at wavelengths as low as 180 nm with a sample volume of only 3 µL.
Secondary structure analysis
The JWMVS-529 CD multivariate SSE analysis program was used to perform a secondary structure analysis on the CD spectra of hemoglobin measured by both the microsampling disc and cylindrical cell. Table 1 shows the calculated results compared with the data obtained by X-ray crystal structure analysis. The secondary structure analysis results obtained for the CD spectra measured using the microsampling disk are in good agreement with both the results from the CD spectra obtained using the standard cylindrical cell and data from the X-ray crystal structure analysis.
Table 1. Comparison of secondary structure analysis data for hemoglobin. The secondary structure estimation using the JWMVS-529 CD multivariate SSE analysis program was made with the PCR algorithm.
| α-Helix (%) | β-Sheet (%) | Turn (%) | Random (%) | |
|---|---|---|---|---|
| X-ray* | 78.0 | 0.0 | 6.3 | 15.7 |
| Microsampling disc | 73.8 | 0.0 | 10.9 | 15.3 |
| Cylindrical cell | 72.2 | 0.0 | 12.0 | - |
The results of X-ray crystal structural analysis refer to DSSP data included in the PDB.
Conclusion
This application note demonstrates that use of the microsampling disc for CD measurements provides data in good agreement with data obtained using the conventional cell. Additionally, the secondary structure estimation analysis program calculated similar results for both the microsampling disc and cylindrical cell which were consistent with X-ray crystallography data.
Featured Products:

Microscale Samples: Measurement of Hemoglobin and DNA Derived from Bovine Thymus
Introduction
Circular dichroism is an essential tool for the structural analysis of biological molecules such as proteins and nucleic acids. The typical path length of cells used for CD measurements is 1 mm, which makes it possible to measure sample volumes around 400 µL and concentrations as low as 0.1 mg/mL. However, there are many instances in which the sample size is even more limited.
The enhanced sensitivity of the J-1500 CD spectrometer enables CD spectra to be obtained with high accuracy and high signal-to-noise (S/N) ratio, even at microscale sizes, using a newly developed microcell with a small surface area.
In this application note, CD spectra of hemoglobin and DNA derived from bovine thymus are measured using a microsampling disc with the J-1500 CD spectrometer. The measurements were performed with a 3 µL sample volume to demonstrate the sensitivity of the J-1500 with small sample volumes in a microcell.
Experimental
| Measurement conditions J-1500 CD spectrometer, microsampling disc, cylindrical cell | |
|---|---|
| Spectral bandwidth | 1 nm |
| Accumulation | 10 times |
| Data acquisition interval | 0.1 nm |
| Sample concentration | 0.5 mg/mL |
| Scan speed | 100 nm/min |
| Response time | 2 sec |
| Path length | 0.2 mm |
To use the microsampling disc shown in Figure 1, the sample is dropped onto the central part of the disc. The disc is then assembled and the sample is retained in the optical axis of the disk. The disk is then placed in a vertical position in the sample holder.
Keywords
260-CD-0019, Microassay, microsampling disc, microcell, Circular Dichroism, CD, hemoglobin, DNA, bovine thymus, secondary structure, J-1500
Results
CD spectra of hemoglobin and DNA derived from bovine thymus using the microsampling disc and a standard cylindrical cell are shown in Figure 2. The microsampling disc (green line) provided near identical spectra compared to the cylindrical cell (blue line) used. The low-noise CD spectra shown have high signal-to-noise ratios and data was obtained at wavelengths as low as 180 nm with a sample volume of only 3 µL.
Secondary structure analysis
The JWMVS-529 CD multivariate SSE analysis program was used to perform a secondary structure analysis on the CD spectra of hemoglobin measured by both the microsampling disc and cylindrical cell. Table 1 shows the calculated results compared with the data obtained by X-ray crystal structure analysis. The secondary structure analysis results obtained for the CD spectra measured using the microsampling disk are in good agreement with both the results from the CD spectra obtained using the standard cylindrical cell and data from the X-ray crystal structure analysis.
Table 1. Comparison of secondary structure analysis data for hemoglobin. The secondary structure estimation using the JWMVS-529 CD multivariate SSE analysis program was made with the PCR algorithm.
| α-Helix (%) | β-Sheet (%) | Turn (%) | Random (%) | |
|---|---|---|---|---|
| X-ray* | 78.0 | 0.0 | 6.3 | 15.7 |
| Microsampling disc | 73.8 | 0.0 | 10.9 | 15.3 |
| Cylindrical cell | 72.2 | 0.0 | 12.0 | - |
The results of X-ray crystal structural analysis refer to DSSP data included in the PDB.
Conclusion
This application note demonstrates that use of the microsampling disc for CD measurements provides data in good agreement with data obtained using the conventional cell. Additionally, the secondary structure estimation analysis program calculated similar results for both the microsampling disc and cylindrical cell which were consistent with X-ray crystallography data.