Monitoring of Reaction using IR Spectroscopy with Fiber Probe | JASCO
April 25, 2024
 Download This Application
Introduction

The reaction mechanism and dynamic characteristics of chemical compounds have been widely analyzed by monitoring the reaction process using FTIR. Monitoring of the reaction process has been applied to research in organic synthesis, enzymatic reactions and electrochemistry as well as in-situ measurement in reactors; by fitting a fiber probe into the reaction system. The VIR-100/200/300 series spectrometers with a fiber interface can control up to 6 separate fibers (with software control), allowing the monitoring of multiple reactors using a single FTIR. Moreover, since the VIR-200/300 spectrometers offer rapid scan measurement (at up to 25 msec intervals), they can monitor in real-time relatively fast chemical reactions such as for enzymes. A fiber probe can be selected from transmission, reflectance or ATR according to the purpose. In this application note, the reaction process between oil and a surfactant applied to the surface of an ATR prism was measured using rapid scan.
| Measurement Conditions | |||
| Instrument | VIR-200 | Detector | Mid-band MCT |
| Accessory | Fiber Connection Unit | Resolution | 4 cm-1 |
| Fiber Probe | Chalcogenide (Remspec) | Interferometer Drive System | Rapid scan |
| Measurement Method | ATR (ZnSe prism) | Measurement Interval | 80 msec |
| Light Source | High-Intensity Ceramic Source | Max. Measurement Time | 80 sec |
| Beam Splitter | KBr/Ge | ||
Experimental
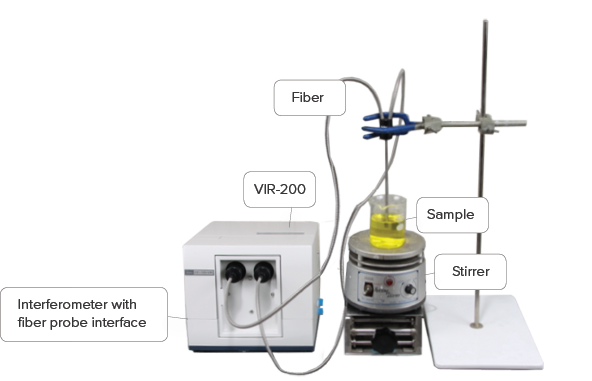
Figure 1 shows the configuration of the system used in this measurement. Since ATR analyzes the interface between the ATR prism and a solution, the measurement can be made easily by putting the tip of the ATR prism into the solution without any adjustment of optical pathlength which is usually required for transmission measurement. A chalcogenide ATR fiber (manufactured by Remspec) with ZnSe prism was used. Cooking oil was applied to the surface of the ATR prism, placed into a stirred vial containing surfactant and the reaction process was monitored using rapid scan.
Keywords
050-AT-0223, FTIR Spectrometer, reaction monitoring, mid-IR fiber probe, fiber probe with ATR, oil analysis, surfactant
Results
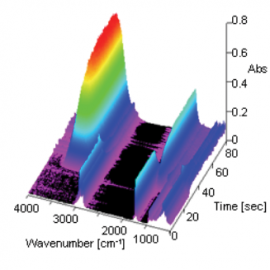
Figure 2 change in spectra with time as 3D data. In this measurement, the ATR prism was placed into the surfactant solution 25 seconds after the start of the measurement. A decrease in intensity of the -CH peak (at 2925 cm-1) attributed to oil and an increase in intensity of the -OH peak (at 1639 cm-1) attributed to the surfactant were observed as time elapsed. Figure 3 spectrum (for surfactant and oil) after the reaction between the oil and surfactant at the surface of the ATR prism and a spectrum (surfactant only) measured on the ATR prism without oil. As shown in the results (pink area) in Figure 3, it can be seen that the peak shape of the surfactant spectrum only was broader when compared with the spectrum of surfactant and oil. This is considered to be due to the ordered structure of surfactant forming micells by the interaction of hydrophobic groups between the surfactant and oil, and the disordered structure of the surfactant when oil is not present.
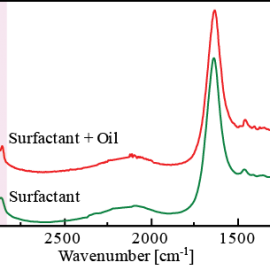
Figure 4 time-dependent change in the -CH peak and -OH peak. It was found that the intensity of the -CH peak slowly and gradually decreased after increased rapidly when the ATR prism touched the surfactant. Conversely, the intensity of the -OH peak rapidly increased after about 25 seconds from the start of the measurement and then slowly increased. This phenomenon indicates that the solubilization (emulsification) and dispersion was occurring in two steps at the surface of the ATR prism. This high-speed reaction process was successfully observed using rapid-scan. It is also expected that the molecular behavior at a solid-liquid interface as well as the monitoring of ordinary chemical reactions can be analyzed using this system. This system can also be applied to the research of liposomes and their use in drug delivery systems (DDS), as well as the basic study of surfactants and emulsions.

Conclusion
In this report, a bi-phasic reaction was monitored using an ATR fiber probe with rapid-scan. The VIR Series can be utilized in a wide range of fields including those that require the use of a glove box, such as the evaluation of lithium-ion battery materials, remote measurement reactors using multi-probes and measurement in process and manufacturing, making full use of the features such as compact size, robustness and highly configurable sample compartment.
Featured Products:
-

Compact fixed range mid-IR spectrometer with options to extend to the NIR/FIR
FT/IR-4X
-
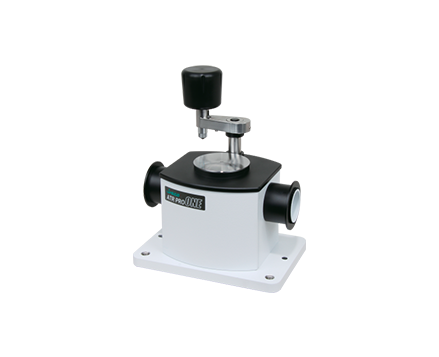
ATR PRO ONE
-
Advanced Research Grade Spectrometer
FT/IR-8X

Monitoring of Reaction using IR Spectroscopy with Fiber Probe | JASCO
Introduction
The reaction mechanism and dynamic characteristics of chemical compounds have been widely analyzed by monitoring the reaction process using FTIR. Monitoring of the reaction process has been applied to research in organic synthesis, enzymatic reactions and electrochemistry as well as in-situ measurement in reactors; by fitting a fiber probe into the reaction system. The VIR-100/200/300 series spectrometers with a fiber interface can control up to 6 separate fibers (with software control), allowing the monitoring of multiple reactors using a single FTIR. Moreover, since the VIR-200/300 spectrometers offer rapid scan measurement (at up to 25 msec intervals), they can monitor in real-time relatively fast chemical reactions such as for enzymes. A fiber probe can be selected from transmission, reflectance or ATR according to the purpose. In this application note, the reaction process between oil and a surfactant applied to the surface of an ATR prism was measured using rapid scan.
| Measurement Conditions | |||
| Instrument | VIR-200 | Detector | Mid-band MCT |
| Accessory | Fiber Connection Unit | Resolution | 4 cm-1 |
| Fiber Probe | Chalcogenide (Remspec) | Interferometer Drive System | Rapid scan |
| Measurement Method | ATR (ZnSe prism) | Measurement Interval | 80 msec |
| Light Source | High-Intensity Ceramic Source | Max. Measurement Time | 80 sec |
| Beam Splitter | KBr/Ge | ||
Experimental
Figure 1 shows the configuration of the system used in this measurement. Since ATR analyzes the interface between the ATR prism and a solution, the measurement can be made easily by putting the tip of the ATR prism into the solution without any adjustment of optical pathlength which is usually required for transmission measurement. A chalcogenide ATR fiber (manufactured by Remspec) with ZnSe prism was used. Cooking oil was applied to the surface of the ATR prism, placed into a stirred vial containing surfactant and the reaction process was monitored using rapid scan.
Results
Figure 2 change in spectra with time as 3D data. In this measurement, the ATR prism was placed into the surfactant solution 25 seconds after the start of the measurement. A decrease in intensity of the -CH peak (at 2925 cm-1) attributed to oil and an increase in intensity of the -OH peak (at 1639 cm-1) attributed to the surfactant were observed as time elapsed. Figure 3 spectrum (for surfactant and oil) after the reaction between the oil and surfactant at the surface of the ATR prism and a spectrum (surfactant only) measured on the ATR prism without oil. As shown in the results (pink area) in Figure 3, it can be seen that the peak shape of the surfactant spectrum only was broader when compared with the spectrum of surfactant and oil. This is considered to be due to the ordered structure of surfactant forming micells by the interaction of hydrophobic groups between the surfactant and oil, and the disordered structure of the surfactant when oil is not present.
Figure 4 time-dependent change in the -CH peak and -OH peak. It was found that the intensity of the -CH peak slowly and gradually decreased after increased rapidly when the ATR prism touched the surfactant. Conversely, the intensity of the -OH peak rapidly increased after about 25 seconds from the start of the measurement and then slowly increased. This phenomenon indicates that the solubilization (emulsification) and dispersion was occurring in two steps at the surface of the ATR prism. This high-speed reaction process was successfully observed using rapid-scan. It is also expected that the molecular behavior at a solid-liquid interface as well as the monitoring of ordinary chemical reactions can be analyzed using this system. This system can also be applied to the research of liposomes and their use in drug delivery systems (DDS), as well as the basic study of surfactants and emulsions.
Conclusion
In this report, a bi-phasic reaction was monitored using an ATR fiber probe with rapid-scan. The VIR Series can be utilized in a wide range of fields including those that require the use of a glove box, such as the evaluation of lithium-ion battery materials, remote measurement reactors using multi-probes and measurement in process and manufacturing, making full use of the features such as compact size, robustness and highly configurable sample compartment.
Keywords
050-AT-0223, FTIR Spectrometer, reaction monitoring, mid-IR fiber probe, fiber probe with ATR, oil analysis, surfactant