FTIR
FTIR Spectrometer
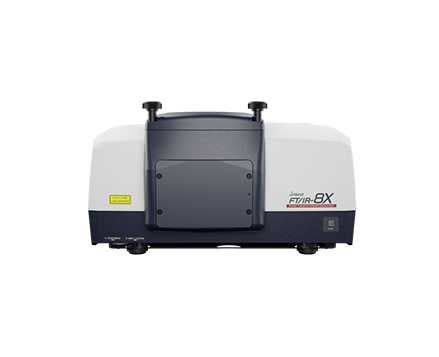
FT/IR-6X
The real advantage of the FT/IR-6X is not the uncompromising performance, but the customization for virtually any type of IR experiment.
The real advantage of the FT/IR-6X is not the uncompromising performance, but the customization for virtually any type of IR experiment.
The FT/lR-6X FTIR spectrometer with a 28° Michelson interferometer and diode timing laser is an excellent choice for more demanding research applications, where higher throughput, better polarization performance, or a more flexible approach to samples and measurement are required.
The configurable optical system applies to virtually any FTIR application, from simple MidIR measurement to more complex analysis in the near and far IR. Research-based measurements are easily performed using the FT/IR-6X spectrometer with options such as full vacuum, gold-coated optics, rapid scan, and step scan.
User-exchangeable components combined with full automation make it possible to perform spectral measurements from 25,000 cm-1 to 20 cm-1 without touching the system. The FT/IR-6X spectrometer is compatible with a range of vacuum and configurable emission ports to perform experiments outside the sample compartment and is also compatible with the comprehensive range of IR microscopes.
User exchangeable beam splitters and windows
The standard spectrometer uses a Ge/KBr beam splitter with KRS-5 windows and a DLaTGS detector with KRS-5 windows, spectral range 7,800 to 350 cm-1. There are a wide range of options to change the spectral range from 25,000 to 10 cm-1, including a fully automated beam splitter and window exchange for unattended operation. With the widest choice of materials, a wide spectral range can be covered using a minimum number of components including a combination of new broad-band beam splitter, window, and detector materials covering the Mid-IR to Far-IR
A multi-zone N2 purge system is standard. This can be used to minimize the interference from environmental gases and vapors (CO2 and H2O elimination algorithms are also included). Available as an option, the interferometer, sample chamber, and detector areas can all be independently evacuated in a full or partial vacuum instrument (useful for fast sample loading) to completely eliminate CO2 and H20 for the most sensitive sample measurements and as the moving mirror does not rely on an air-bearing, the vacuum can easily be maintained.
The FT/IR-6X has several options for optical ports with a range of window materials for the measurement of external sources of light and black body devices.
Optional Rapid Scan offers spectral collection at up to 20 Hz.
The FT/IR-6X is controlled by Spectra Manager™ cross-platform software. Spectra Manager™ includes Spectra measurement, Quick-Start, spectral comparison, and quantitative analysis as standard functions. Library search and analysis with KnowItAll Informatics JASCO Edition.
The sample measurement screen can be customized according to user requirements and the customized screen and parameters can be saved for future use (User Adaptive Software).
Measurement parameters and data acquisition/spectral processing sequence are displayed.
Data analysis results such as spectral comparison and sample quantification are displayed and readily available.
A real-time data processing function can be used to verify the current spectrum during measurements. Spectra stored in thumbnails can also be overlaid with the current spectrum during sample measurements.
Target peak and functional group information can be easily checked using the zoom function.
The measured spectra can be stored as thumbnails within the thumbnail window. The thumbnails can be individually selected and viewed in Spectra view.
Before the start of sample measurement, the data processing procedures can be verified by checking the results of real-time data processing in a preview window.