FTIR

History of FTIR Spectroscopy
Early Infrared Spectrometers
Infrared spectrometers were first developed in the United States in the mid-1940s. Initially, their applications were confined to research and development work on organic compounds. In 1954, the first Japanese instruments were manufactured by the Applied Optics Research Institute, the predecessor of JASCO.
Modern Infrared Spectrometers
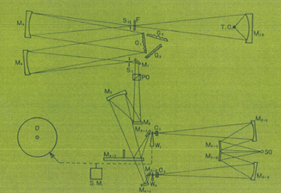
In the 1970s, the first commercial Fourier Transform infrared (FTIR) spectrometer appeared. In FTIR spectrometers, spectra are generated in the time domain by following the position of a moving mirror and the occurrence of constructive and destructive interference. A Fast Fourier Transform (FFT) then converts the signal from the time into the frequency domain. Since the FFT calculation takes time to compute, the development of commercial FTIR spectroscopy closely followed the trend of the increased power and miniaturization of computers. By the 1980s, dispersive infrared spectrometers were phased out for the more desirable interferometer type spectrometers as computers became more widespread. In 1982, JASCO developed its first FTIR spectrometer.
FTIR spectrometers have three main advantages over dispersive spectrometers:
- Fellgett’s Advantage – the full spectrum reaches the detector simultaneously (instead of a small band of radiation as in grating-based spectrometers), the spectrum takes much less time to collect.
- Jaquinot’s Advantage – since there are fewer optics and no slits, the total power at each data point is much greater.
- Conne’s Advantage – the resolution is much greater than with a grating, enabling spectral subtraction, concentration curves, and library searches among other functions.
By using an interferometer, it should be noted that a couple of features in a dispersive monochromator, such as fixed wavelength measurements and double beam optical configurations are not allowed in a FTIR spectrometer.
FTIR Spectroscopy Principles
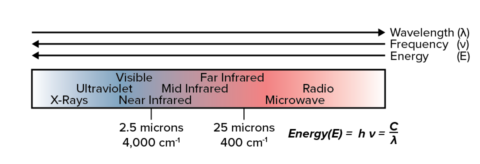
The electromagnetic spectrum consists of different regions corresponding to different energy (E), frequency (ѵ), and wavelength (λ) ranges as seen in Figure 2. The unit for near-, mid-, and far-infrared, the wavenumber (cm-1), is derived from the inverse relationship between wavelength and frequency.
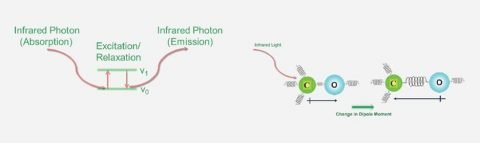
FTIR spectroscopy takes advantage of how IR light changes the dipole moments in molecules (Fig. 3) that correspond to a specific vibrational energy. Vibrational energy corresponds to two variables: reduced mass (μ) and bond spring constant (k) (Equation 1). For k constant, we can look at C-C, C=C, and C≡C showing an increase of 800 cm-1 across the series (Table 1). Substituting atoms in a C-C bond with nitrogen and oxygen causes a shift of 100 cm-1 (Table 2). By looking at the two series, it can be seen that bond strength alters the wavenumbers more than mass.

Identification of Molecules using FTIR Spectroscopy
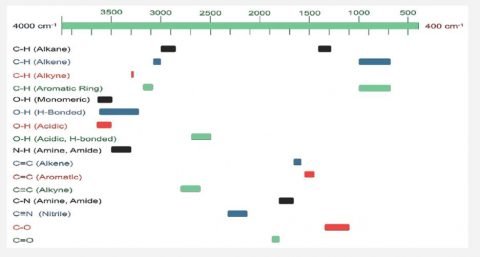
Since every functional group is composed of different atoms and bond strengths, vibrations are unique to functional groups, and classes of functional groups (e.g. O-H and C-H stretches appear around 3200 cm-1 and 2900 cm-1, respectively). A correlation chart with various functional group vibrations can be seen in Figure 3. Since the collection of vibrational energy bands for all of the functional groups a molecule is unique to every molecule, these peaks can be used for identification using library searches of comprehensive sample databases.
Further Reading on FTIR Spectroscopy
Complementary Techniques:
-


FTIR microscopy is ideal for imaging materials using functional group(s), sample identification, multilayer film characterization, and particle analysis.
FTIR Microscopy
-
This technique can be used for chemical or molecular analysis encompassing depth profiling and mapping of samples with spatial resolution as little as 1 μm.
Confocal Raman Microscopy
-


An FTIR ATR method may be a suitable alternative and offers advantages such as minimal sample preparation, non-destructive measurement, and easy handling.
ATR FTIR