FTIR


Attenuated Total Reflectance (ATR)
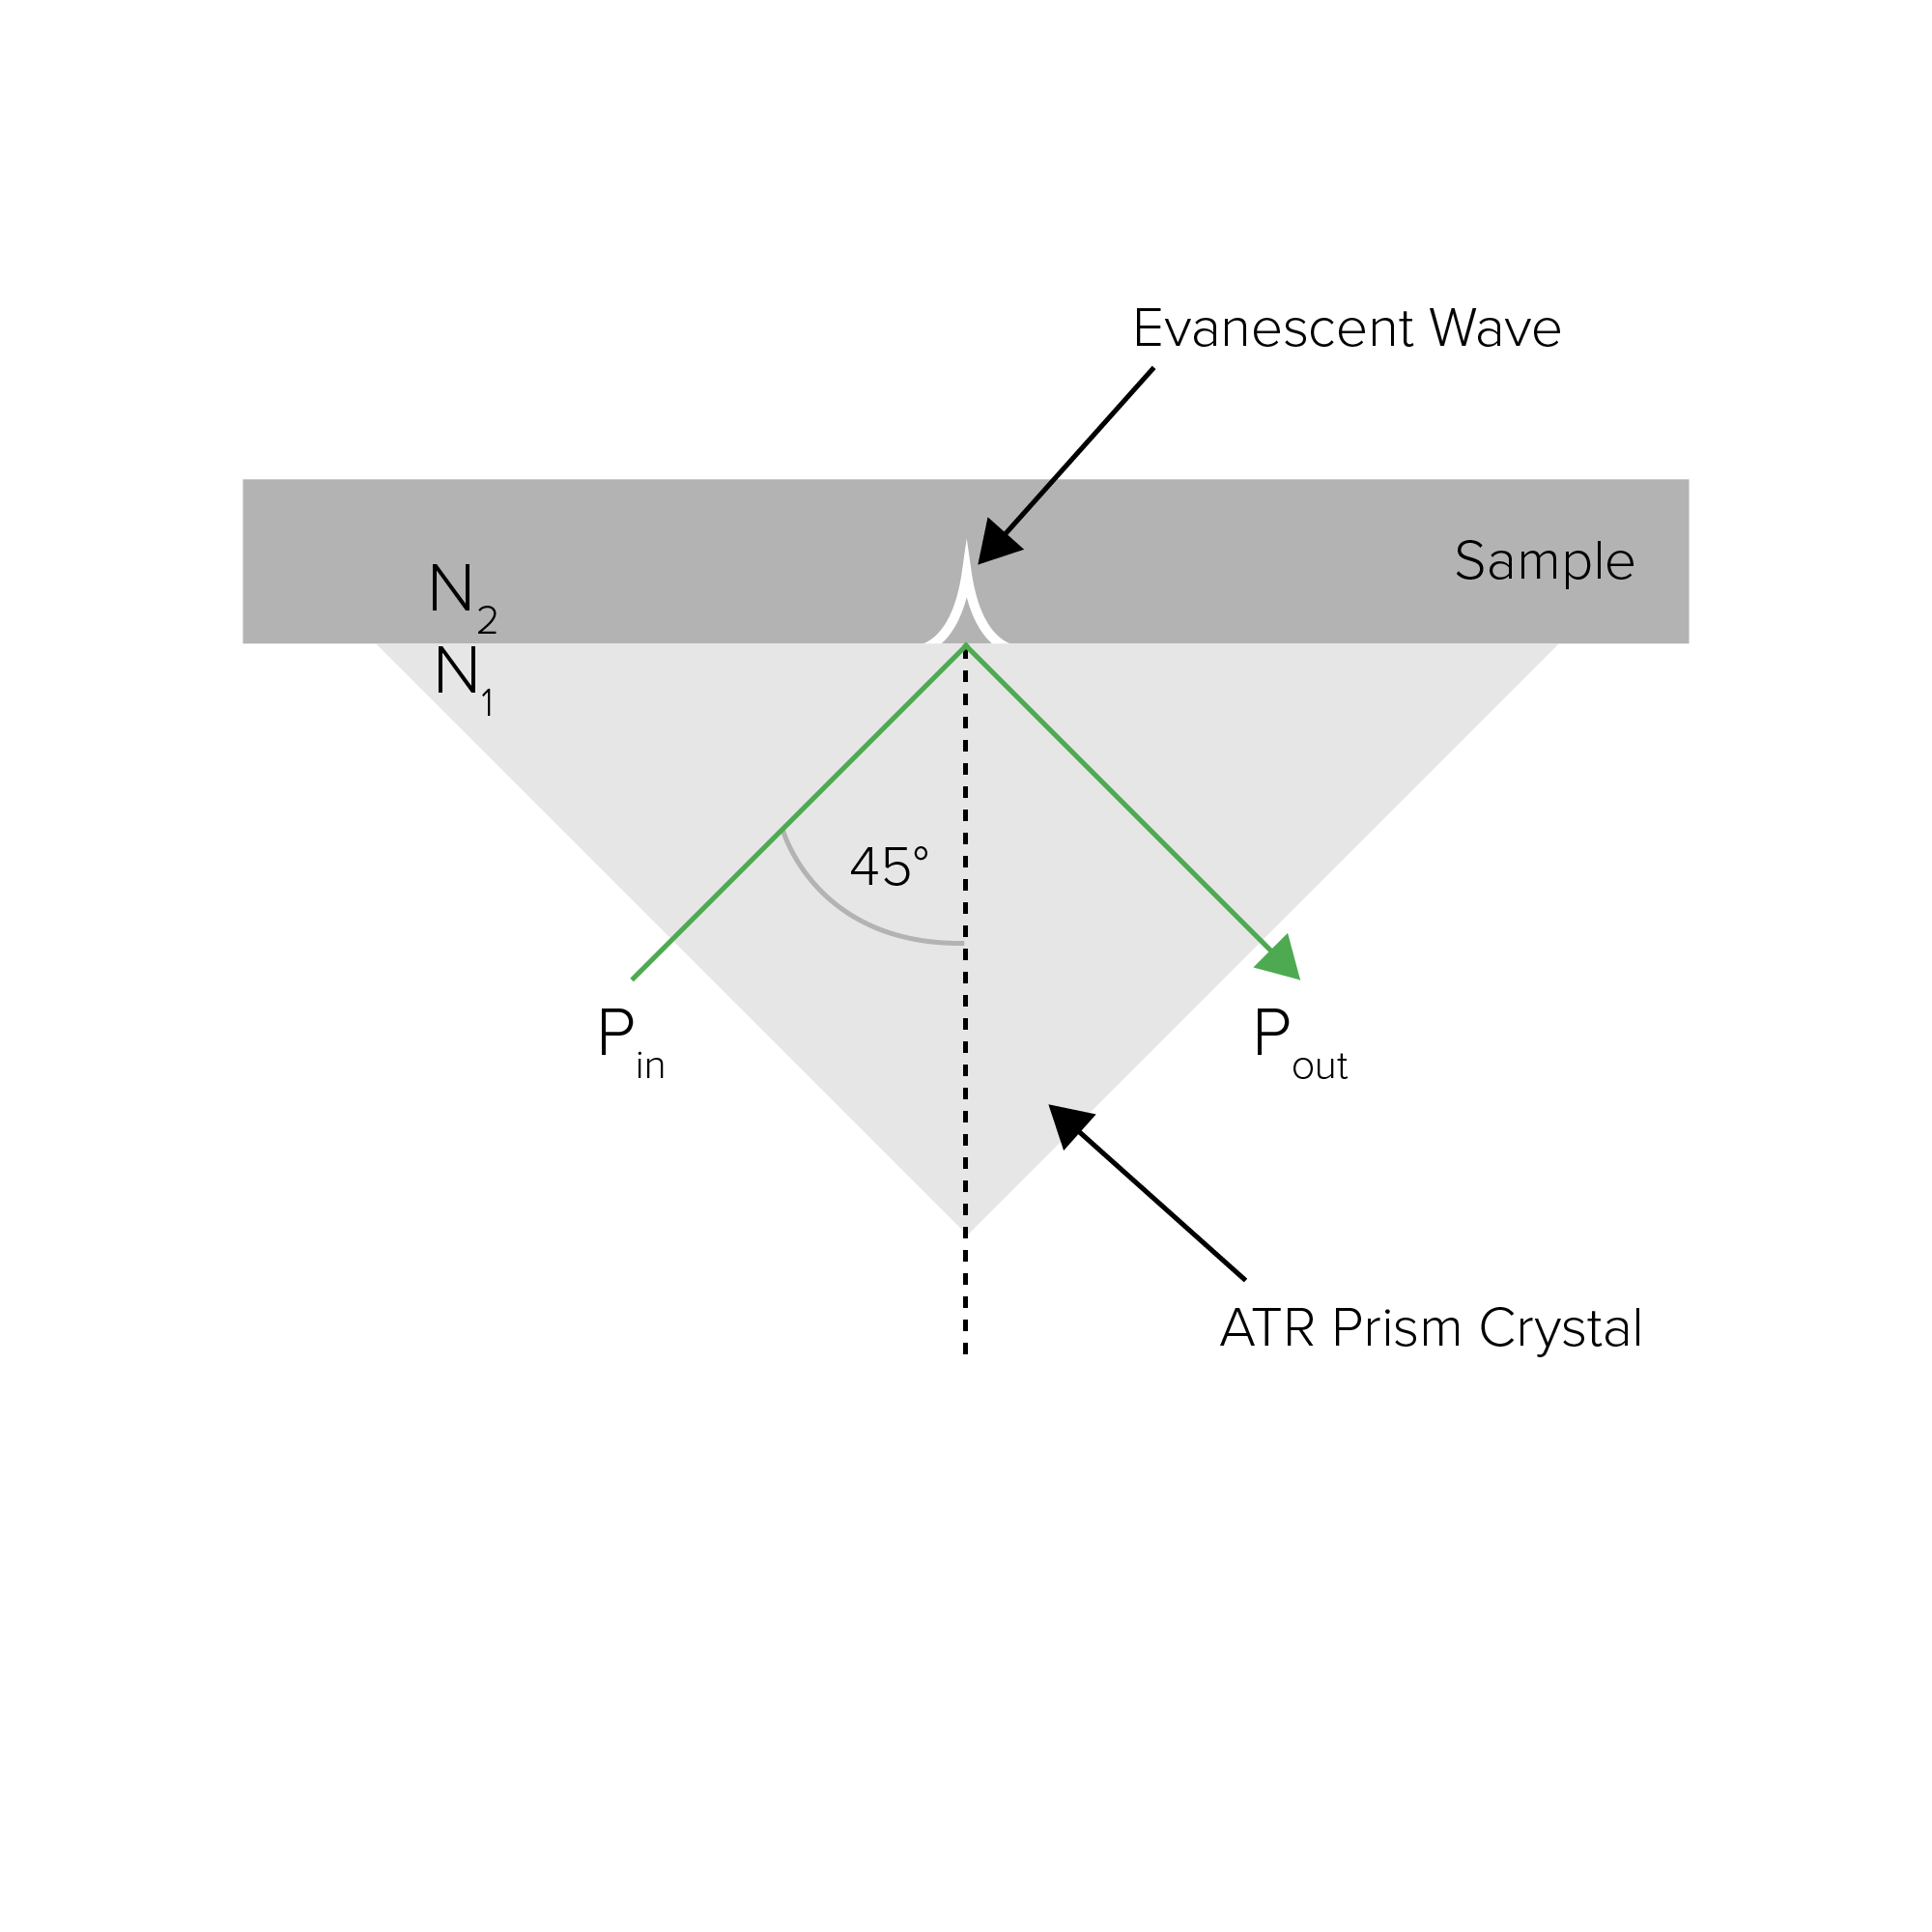
Attenuated Total Reflectance (ATR) has become the primary sampling method for FTIR spectroscopy. The major advantage of ATR is the lack of sample preparation for liquid and solid samples. When light reflects off certain materials (diamond, ZnSe, etc.) at a critical angle, the light undergoes total internal reflectance with a small amount of light being absorbed into the sample in contact with the crystal surface (Figure 1). The penetration depth is dependent on the refractive index of both the sample (generally ~1.5 μm) and the crystal itself. Since the refractive index is dependent on wavelength, spectra taken with ATR have slightly different intensity ratios across the spectrum and may need to be corrected to compare to transmission spectra.
The three most common crystals are diamond, zinc selenide, and germanium, each having advantages and disadvantages. Diamond crystals are rugged, have a penetration depth of 1.5 μm, and a low wavenumber cutoff (200 cm-1), but have poor throughput in the 2,200 cm-1 region. ZnSe has exceptional throughput but a high wavenumber cutoff (650 cm-1). Germanium has a very low penetration depth (0.8 μm) and is useful for highly absorbing substances.
Transmission Techniques
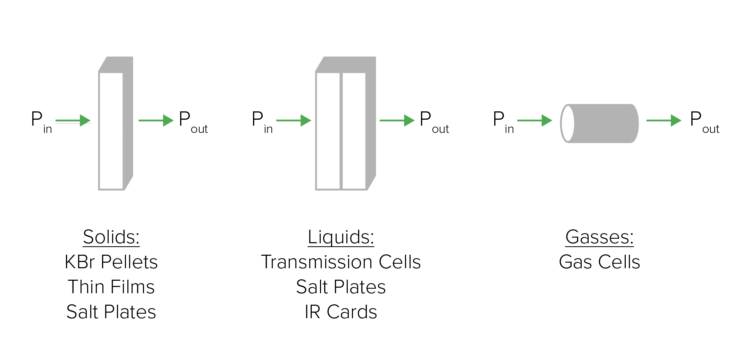
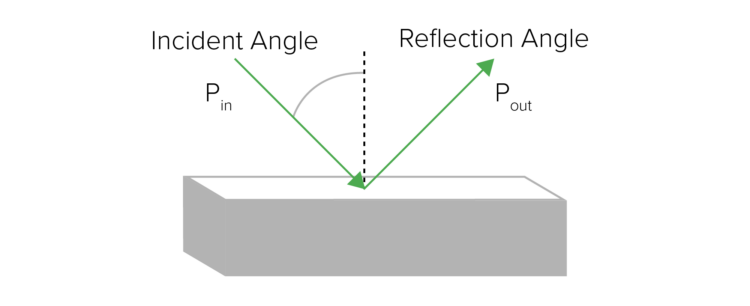
Transmission is the most straightforward technique but requires the most sample preparation. In transmission FTIR spectroscopy, incident light, from an infrared source, passes through a sample and the transmitted light is measured by a detector on the other side of the sample. The transmission spectrum is produced by ratioing the intensity of the incident light (Pin) to the intensity of the transmitted light (Pout): T = Pout / Pin (Figure 2). There are a variety of sampling techniques that can be used to obtain transmission spectra depending on the state of matter of the sample. For solids, the sample can be pressed into a KBr pellet, sandwiched between KBr salt plates, or mixed with a mineral oil to create a mull. For liquids, the sample can be injected into a liquid cell, sandwiched between KBr salt plates, or applied to an IR transparent card. For gases, the sample can be introduced into a gas cell.
KBr Pellet
The KBr pellet technique is used to measure the transmission of powdered solids. A small amount of powdered sample is mixed with a powdered alkali halide (most commonly potassium bromide, KBr), pressed into a pellet using a pellet die, and placed into a pellet holder. Powdered alkali halides are transparent in the mid-IR (4,000 – 400 cm-1) region and form pellets when subjected to high pressure. A blank KBr pellet, containing no sample, is required to obtain a background spectrum to correct for light scattering losses in the pellet and moisture absorbed by KBr. The main disadvantage of this technique is that KBr is hygroscopic and absorbs moisture from the atmosphere. As a result, this technique is not suitable for measuring samples with absorption bands in the same regions as water. Samples that contain chlorides and hydrochlorides are generally prepared using potassium chloride, KCl, since a halogen exchange reaction occurs between Br and Cl when using KBr.
KBr Plate
The KBr plate technique is used to measure the transmission of powdered solids when simple sample preparation is required, or for measuring highly hygroscopic samples. A powdered sample is sandwiched between two infrared transparent window plates (NaCl, KCl, KBr, KRS-5 CsI, CaF2, Quartz, Polyethylene, etc.) and placed into a demountable cell. One of the most common window plate materials is KBr, which is extremely fragile and hygroscopic. KBr plates should be handled with care to prevent the plate from becoming scratched or chipped, thoroughly cleaned after each use, and properly stored in a desiccator to prevent the plate from absorbing moisture from the atmosphere and becoming cloudy. It should be noted that samples that contain large particles are susceptible to scattering of light, so the measured absorbance may be lower than the true value.
Samples that can be formed into thin films with a thickness of 10 μm or less can also be measured. There are various thinning methods that can be used for sample preparation, such as stretching, cutting, and hot pressing. If the sample is soluble in a solvent, the solution can be applied to a KBr plate and evaporating the solvent to form a thin film.
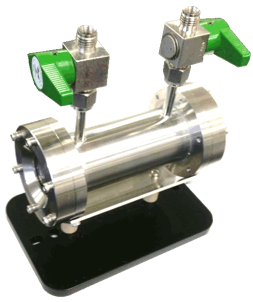
Gas Cell
Gas cells are used to measure the transmission of gases and are often heated to avoid condensation inside the cell. Infrared transparent windows (BaF2, CaF2, NaCl, ZnSe, KBr, SiO2, etc.) seal the gas cell and allow the infrared beam to pass into the gas cell, through the sample, and onto the detector. The pathlength of the gas cell should be adjusted based on the concentration of the gas; a low-concentration gas will require a longer pathlength than a high-concentration gas. The amount of water vapor and carbon dioxide in a gas can be determined if the system is under a full vacuum or a N2 gas purge is performed on the system prior to measurement. One disadvantage of this technique is that gases usually produce sharp absorption peaks, requiring high-resolution instruments to achieve high-quality measurements.
Reflectance Techniques
Specular Reflectance
Specular reflectance is useful for analyzing smooth, flat surfaces, such as mirrors. Specular reflection is the reflection of light from a surface where the angle of reflection is equal to the angle of incidence (Figure 5). This technique requires little or no sample preparation.
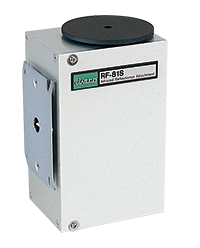
Specular Reflectance Accessory
Sometimes specular reflectance spectra include both the imaginary and real components of the light, giving rise to derivative peaks or other distortions. These distortions make it difficult to search spectral libraries, which are usually collected in transmission. A Kramers-Kronig correction can mathematically eliminate the spectral distortions resulting from specular reflectance measurements and creates a spectrum that looks as if it were collected in transmission (Figure 3).
Diffuse Reflectance Infrared Fourier Transform Spectroscopy (DRIFTS)
Diffuse Reflectance Infrared Fourier Transform Spectroscopy (DRIFTS) is useful for analyzing rough surface solids and powders. Diffuse reflectance is the reflection of light from a surface where the incident light is scattered at many angles. Incident light is absorbed by each particle in the sample and re-emitted by the combined process of reflection, refraction, and diffraction. The re-emitted light can then be absorbed and re-emitted by other particles in the sample.
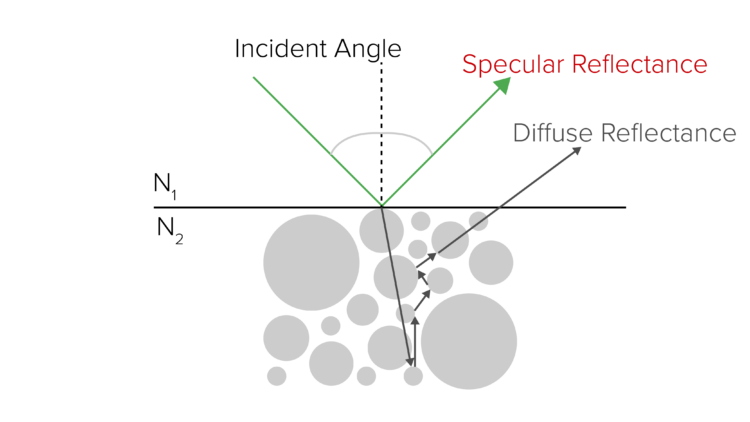
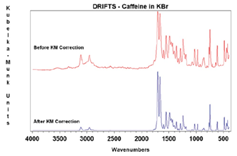
Samples can be measured as a solid powder (neat), a powder mixed with KBr, or abraded on special abrasive paper. If a sample is too absorbent to be measured neat, it can be mixed with an infrared transparent material, such KBr or KCl, to ensure a deeper penetration of the incident light into the sample, increasing the contribution of the diffuse scattered component and minimizing the contribution of the specular reflection component in the spectrum. The sample should be finely ground and loosely but evenly packed in the sample cup to further increase the penetration depth. Quantitative analysis is possible, but often quite difficult since the particle size, packing, and dilution of the sample must be carefully controlled. A background spectrum must first be collected of the infrared transparent material. To properly compare relative peak intensities from a transmission spectrum, a Kubelka–Munk correction is required (Figure 4).

Infrared Reflection–Absorption Spectroscopy (IRRAS) / Reflection–Absorption Infrared Spectroscopy (RAIRS)
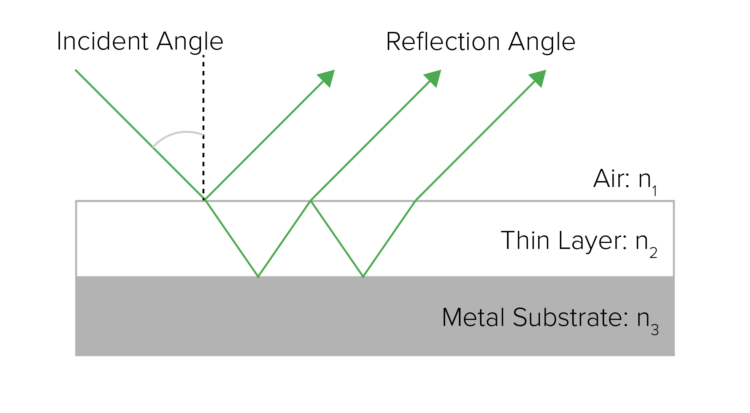
Infrared Reflection–Absorption Spectroscopy (IRRAS) or Reflection–Absorption Infrared Spectroscopy (RAIRS) is useful for analyzing thin films on metal substrates with high sensitivity using p-polarized light parallel to the plane of incidence. The electric vectors in the incident and reflected p-polarized light interfere to mutually strengthen and form an electric field of stationary vibration. The interaction of this electric field with a thin film on the metal surface causes an absorption that is stronger than simple transmission measurement, allowing film thickness measurements at the angstrom (Å) level.
Reflection–Absorption Infrared Spectroscopy (RAIRS)
Despite this, absorption peaks obtained by IRRAS are usually very small, and often require a long accumulation time. In addition, both a reference and a sample substrate must be measured. For these reasons, the spectra can be significantly affected by the absorption of atmospheric H2O and CO2. This technique does not require a KK correction like specular reflectance.
Polarization Modulation–Infrared Reflection–Absorption Spectroscopy (PM–IRRAS)
Polarization Modulation–Infrared Reflection–Absorption Spectroscopy (PM–IRRAS) obtains a measurement of thin films with greater sensitivity than ordinary IRRAS, allowing the process monitoring of the generation of thin films with thicknesses of nanometers or greater on metal substrates in a vacuum chamber.
PM-IRRAS measures the intensity difference in s- and p-polarized light (ΔI = Ip – Is), vertical and parallel to the plane of incidence, respectively, using a Photoelastic Modulator (PEM). The principle of operation of a PEM is based on the photoelastic effect, in which a mechanically stressed optical element exhibits birefringence proportional to the resulting strain. In a PEM, a voltage is applied to the crystal based on the principle of an inverse piezoelectric effect so that the transparent optical element will be distorted as a result. The distortion produces a birefringence of the crystal, and the polarization direction of the light can be modulated by applying a suitable voltage for the wavelength of light used for the measurement.
As s-polarized light does not generate an electric field of stationary vibration, the absorption is much smaller than that of p-polarized light. In PM-IRRAS, the sum of s- and p- polarization signals (Σ I = Ip + Is) is used as a reference, eliminating the requirement to measure a reference substrate. As a result, the effect due to the absorption of atmospheric H2O and CO2 can be greatly decreased. In addition, the results are free from the effect of differences between substrates and the overall measurement time can be shortened. PM-IRRAS measurement allows higher sensitivity by detecting small ΔI signals using a direct lock-in detection by adopting dual modulation spectroscopy of the FTIR interferometer and PEM.
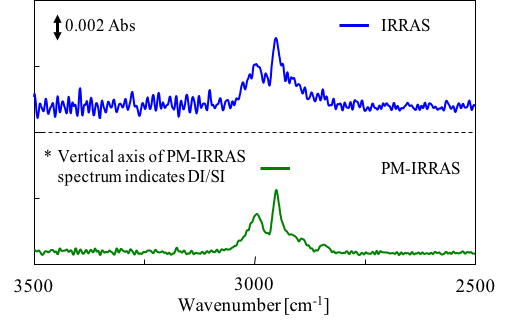
Comparison of IRRAS and PM–IRRAS
Fig. 2 shows the results of a Polymethyl Methacrylate (PMAA) thin film on an Al mirror measured by IRRAS and PM-IRRAS with all other conditions remaining the same. The S/N of spectra obtained using PM-IRRAS are several times better than IRRAS.