IRT Microscope Software
-
Spectra Manager™
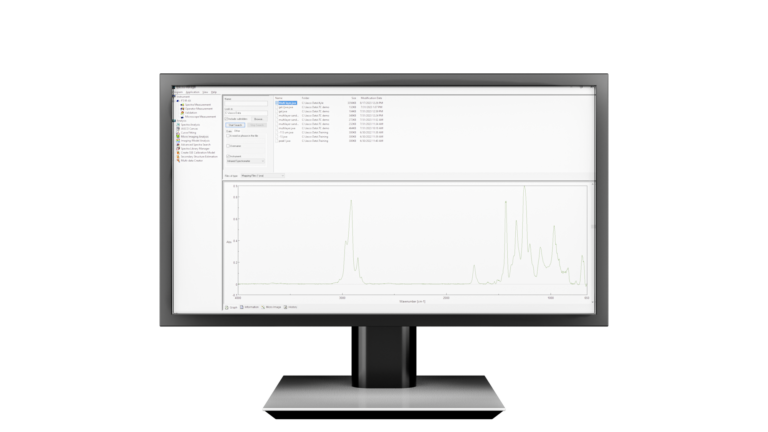
Spectra Manager™ is a cross-platform suite of spectroscopy software for designing experimental methods, acquiring data, and processing results. This comprehensive package for controlling an entire range of molecular spectroscopy instrumentation eliminates the need for multiple software packages. Use the Folder function to find files by folder directory or use the Search function to find files within a folder directory based on keywords, username, date created, or instrument.
-
IR Microscope Measurement Software
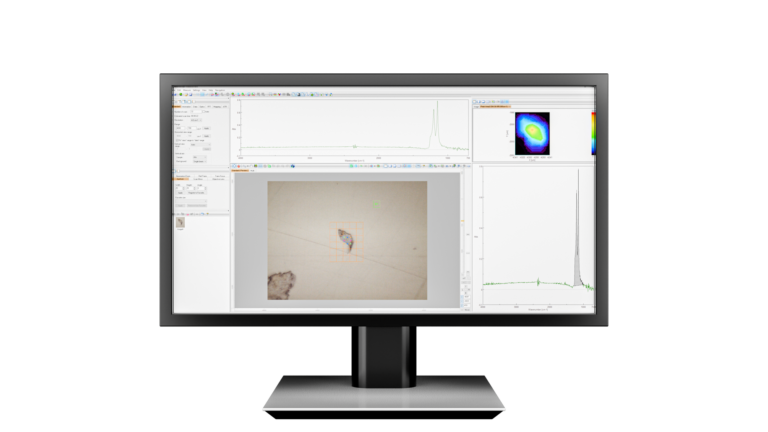
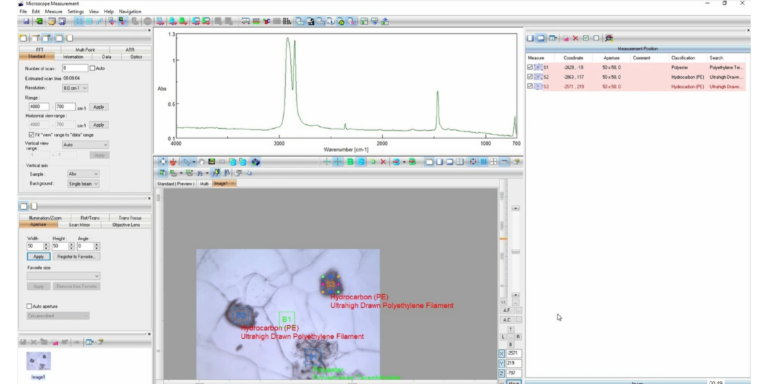
The IR Microscope Measurement program has five principal functions: Observation, Navigation, Imaging, Mapping, and Analysis. Navigate around samples by doubling-clicking with the standard cursor, clicking and dragging with the arrow cursor, using the optional joystick, using the thumbnail display, using the sub-map display, or using the multi-window display. Samples can be viewed as a single field image or a multi image, which provides a broad area image synthesized from a collection of single field images obtained using the automatic XYZ stage. IQ Monitor can be used to survey the multi image for potential measurement points, which can then be registered for automatic measurement with IQ Mapping. The spectra being acquired, together with a functional group mapping image, can be displayed in real-time. The spectral data and optical images can be saved together in a single file, which can then be opened in the IR Microscope Analysis software for further analysis.
-
IR Microscope Analysis Software
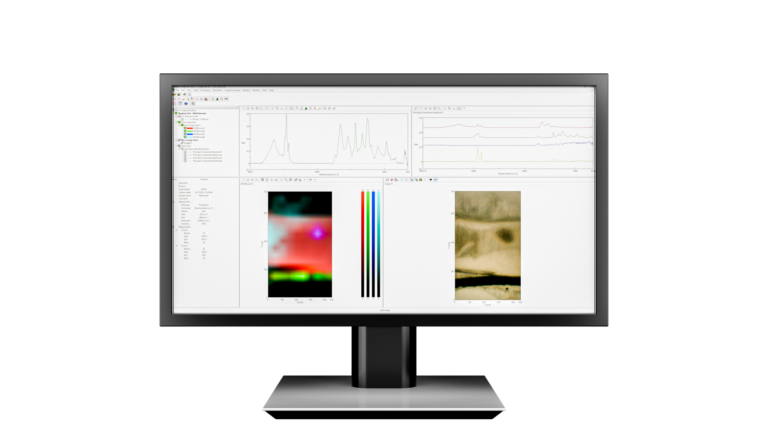
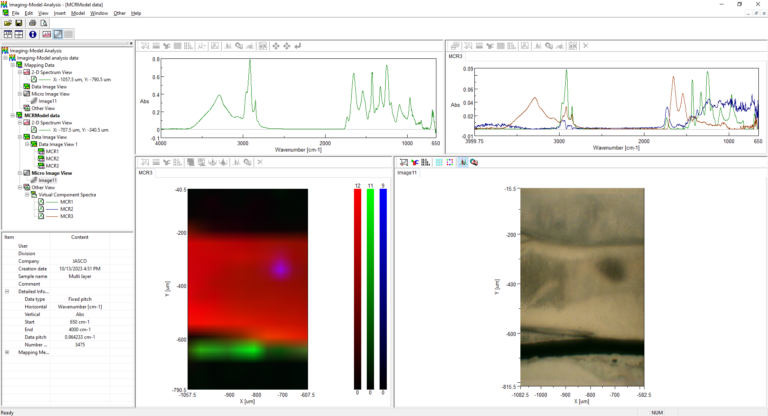
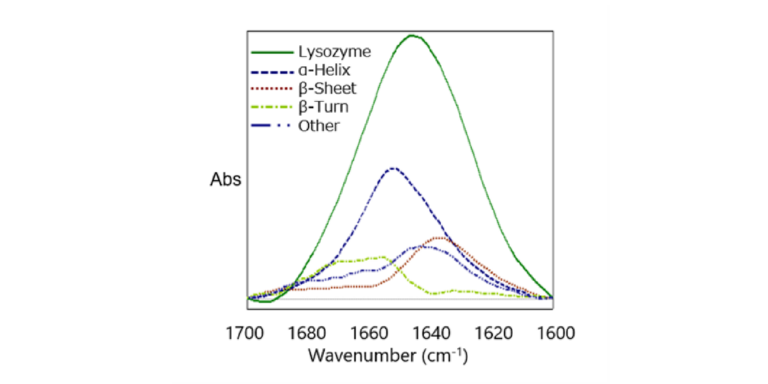
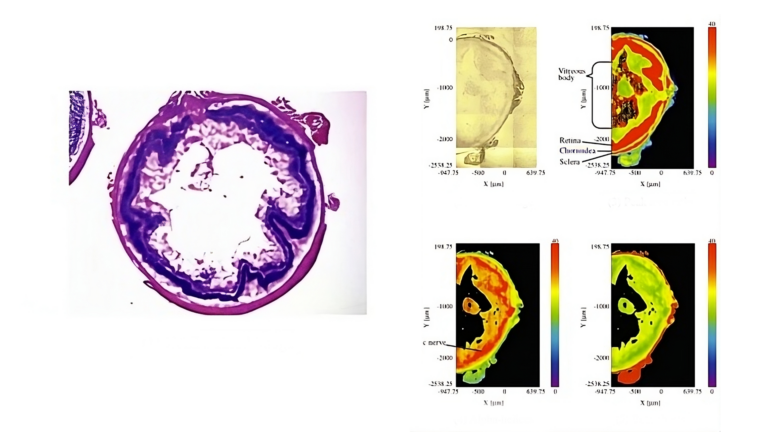
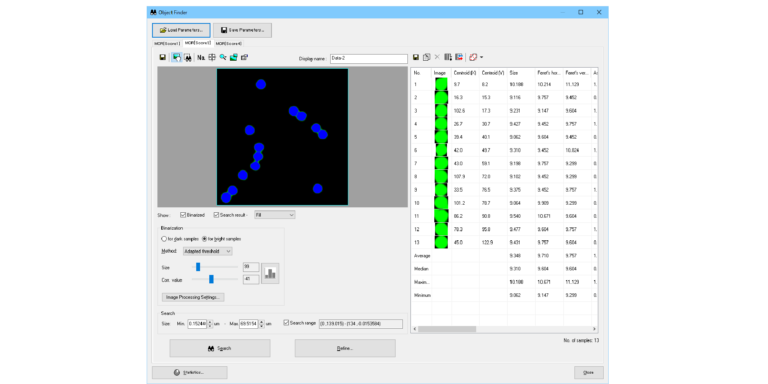
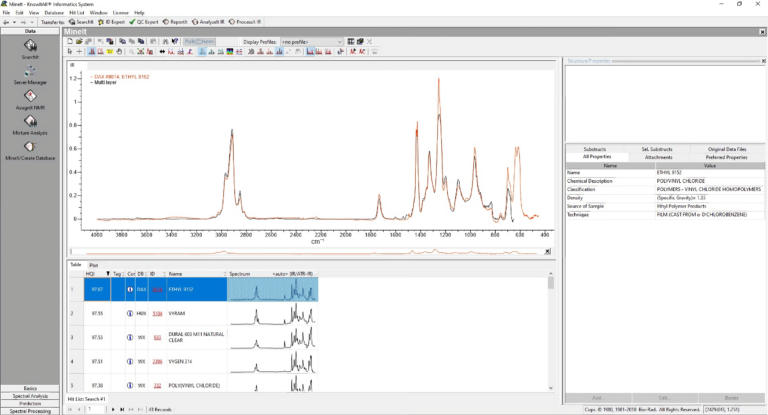
The Spectra Manager™ Micro Imaging Analysis program has many data processing functions for spectra as well as tools for creating and viewing a chemical image. The user can create a chemical image by cursor operation in the viewed spectrum and peak height or peak area is used to identify and visualize the distribution of functional groups.
Home / Products / Molecular Spectroscopy / Spectra Manager™ Spectroscopy Software / FTIR Microscopy Spectra Manager

