IRT & NRS

JASCO Particle Analysis

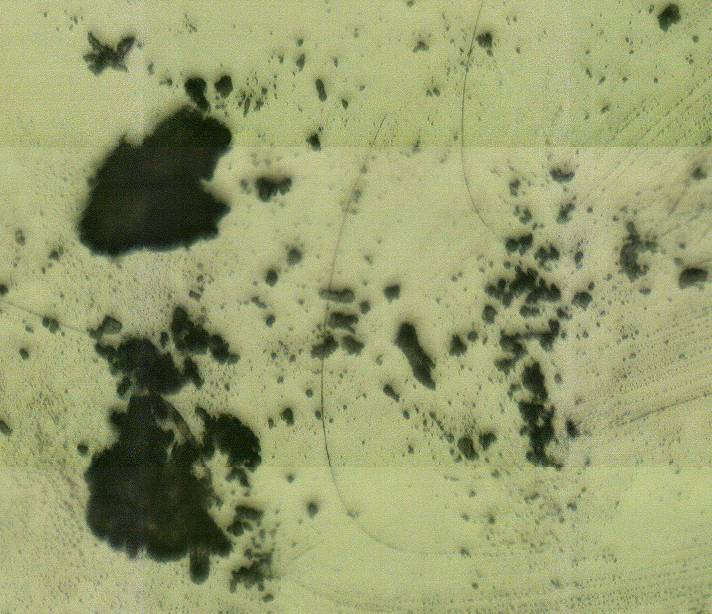
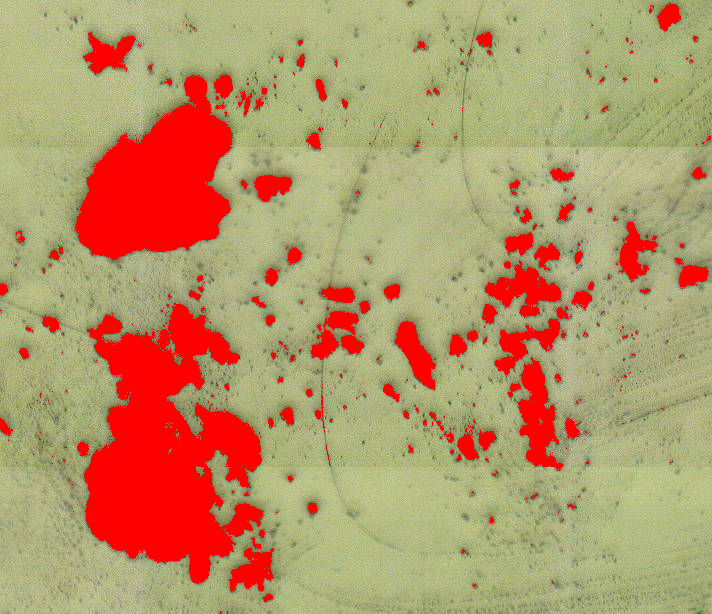
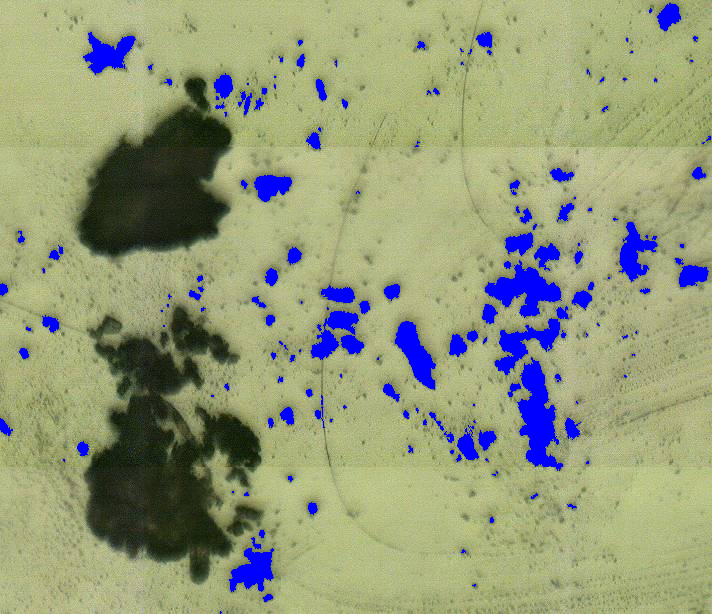
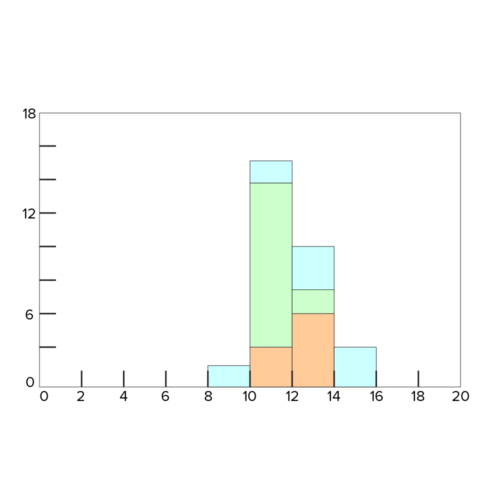
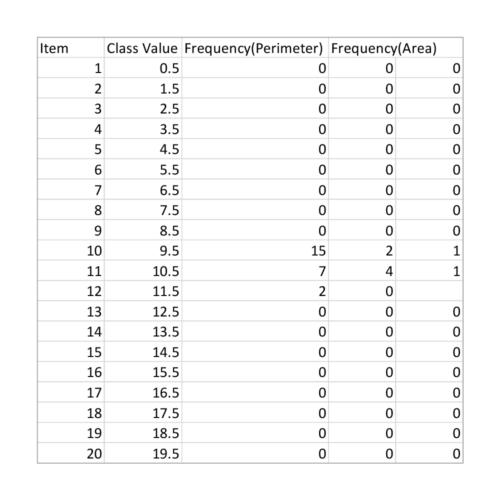
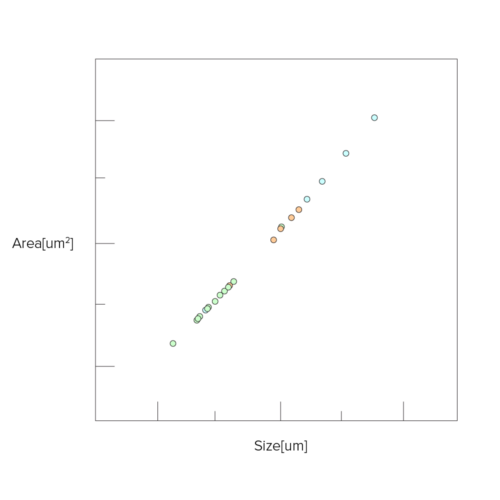
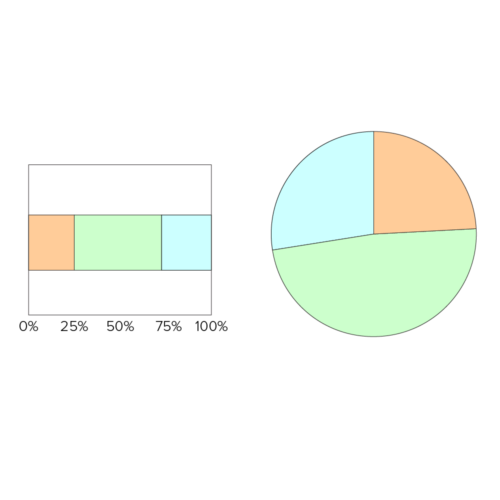
JASCO Particle Analysis (JPA) is an optional program for the Micro Imaging Analysis application that can perform particle analysis with statistical processing. This program allows the user to evaluate the variation in particle size and shape, etc. The particle size distribution can be displayed as a histogram together with sample shape information from the observed image, combined with the chemical images. This method is particularly useful for the analysis of a variety of different materials such as microplastics, foods, pharmaceuticals, and resins.

Particle Analysis Search

An optical image of the sample microscope position when the mapping data was measured.

The binarization result is overlaid on the optical image in red (default). There are two options for binarization: binarization for bright samples and binarization for dark samples.

Narrow down the Search Results of the optical image by setting the sample search size. The Search Results are overlaid on the optical image in blue (default). The Search Results of the optical image can also be refined using the Search Parameters below.

Narrow down the Search Results of the optical image by setting the sample search size. The Search Results are overlaid on the optical image in blue (default). The Search Results of the optical image can also be refined using the Search Parameters below.

The Search Results overlaid on the optical image in blue (default) with the Binarization overlaid on the optical image in red (default).

Search Parameters

Gather Data from an Optical Image

The Search Results are displayed on the right of the Object Finder window with the results of the selected Search Parameters for each identified particle.

Organize, Plot, and Visualize

Using the statistical processing function, a stacked histogram for each component, a frequency table, a correlation graph, and a component ratio can be displayed.

A Histogram is a graphical representation of the distribution of a dataset used to visualize the occurrence (frequency) of values within different intervals along a continuous range of values.

A Frequency Table, also known as a Frequency Distribution Table, displays the number of occurrences (frequency) of various categories or values within a dataset.

A Correlation Graph displays the relationship between variables in a dataset to illustrate the degree and direction of correlation or association between pairs of variables.

A Component Ratio is used to display data as a circle divided into sections that represent a proportion or percentage of the whole to illustrate the composition or distribution of a dataset.