IRT


The IMV-4000 enables infrared imaging at up to 1 to two orders of magnitude faster than using a conventional single-element detector. JASCO has proposed an analysis of imaging data with a variety of multivariate analysis techniques to accelerate the processing of infrared imaging data. For example, we have made it possible to easily create a visualization of the distribution map for the various components of multilayer film by analyzing imaging data using Principal Component Analysis (PCA). We have also created a model that performs Secondary Structure Estimation (SSE) on proteins based on IR spectra by Principal Component Regression (PCR) and Partial Least Squares (PLS) regression.
In the secondary structure estimation of proteins, crystallizing the protein, performing x-ray structural analysis, and measuring aqueous solutions by NMR or CD spectra are all widely used. However, the estimation of the secondary structure of proteins while preserving the tissue structure in multicomponent systems such as biological structures is extremely difficult with those techniques. On the other hand, since IR spectra can be easily measured, even for non-crystalline samples, it is possible to perform analyses in a near ‘in vivo’ state, without having to refine the secondary structure of the proteins included in living tissue. By the use of micro-FTIR, it is possible to perform spatial analysis while preserving the tissue structure. The measurement and analysis of a cancer biopsy sample has been reported for the secondary structure of proteins using imaging data.
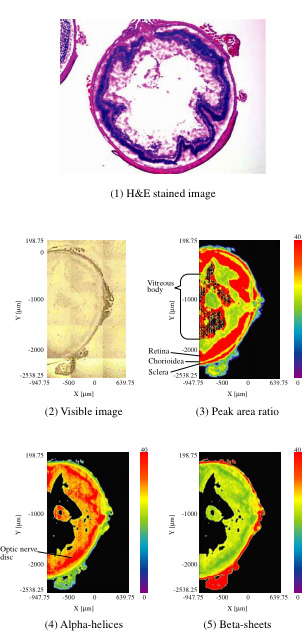
We performed infrared imaging on slices of a mouse eyeball using the IMV-4000. We analyzed the IR spectra of each using Principal Component Regression (PCR) and created an in-plane distribution map of the secondary structure of proteins (Figure 1). The measured area was 2,750 x 1,600 µm and the measurement size was 12.5 x 12.5 µm since a 16x Cassegrain objective was used. 128 x 220 (28,160) points were measured. There were four accumulations and the spectral resolution was 8 cm-1. The slice was placed on BaF2 (10 mm diameter and 1 mm thick) and measured in transmission.
Figure 1-(1) shows an H&E (Hematoxylin and Eosin) stained image of the slice and Figure 1-(2) shows a visible image of the measurement area. Figure 1-(3) shows the ratio of the absorption peak of amide I (near 1,640 cm-1) and the peak of the stretching vibration (near 2,900 cm-1) of the -CH base. In addition, Figure 1-(4) and (5) show the distribution maps for the α-helix and β-sheet of the protein, respectively. We were able to confirm the correspondence between the H&E stained image and each tissue. In addition, the site corresponding to the two-layer retina and optic nerve disc has an α-helix structure and is believed to show proliferation potential.