IRT

IR Microscope Measurement Software

Spectra ManagerTM Microscope Measurement Program

The IR Microscope Measurement program has five principal functions: Observation, Navigation, Mapping, Imaging, and Analysis.

Navigation, search for measurement locations within the sample by:

  1. Doubling-clicking the target location with the mouse cursor will immediately move the XYZ stage to the position of the mouse cursor.
  2. Clicking and dragging with the mouse arrow cursor will move the XYZ stage in the direction of the arrow.
  3. Double-clicking in the sub-map display will move the XYZ stage to the location selected in the sub-map.
  4. Click on a previously recorded thumbnail image to return to the potential measurement position of that specific location.
  5. Use the optional joystick to move the stage around in X, Y, and Z directions.

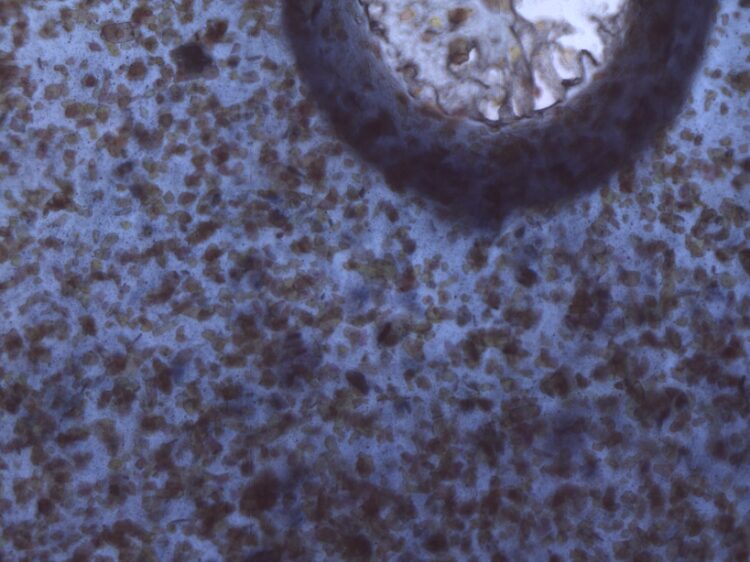
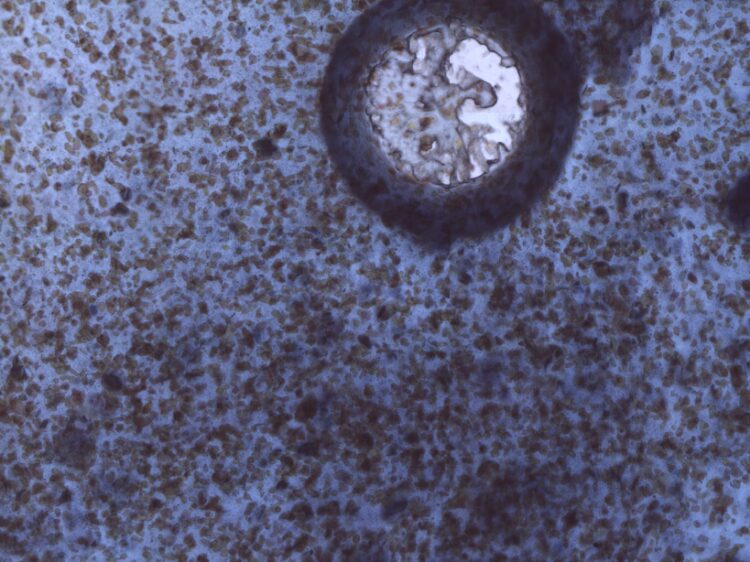
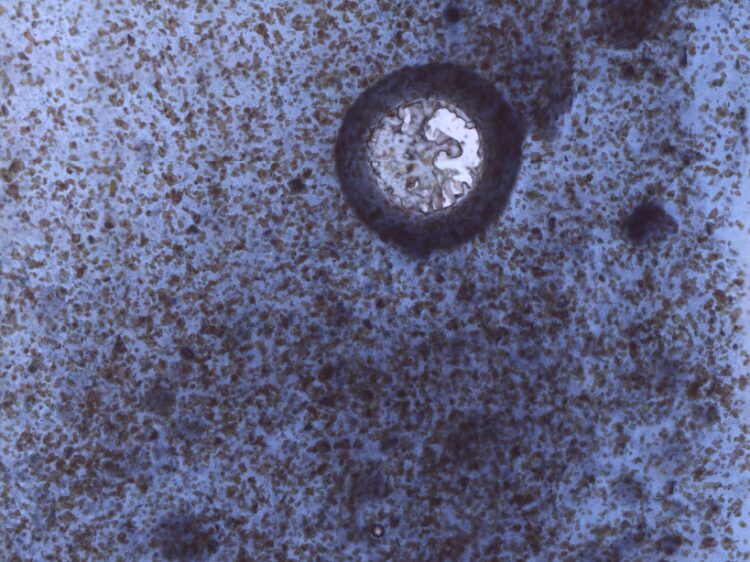
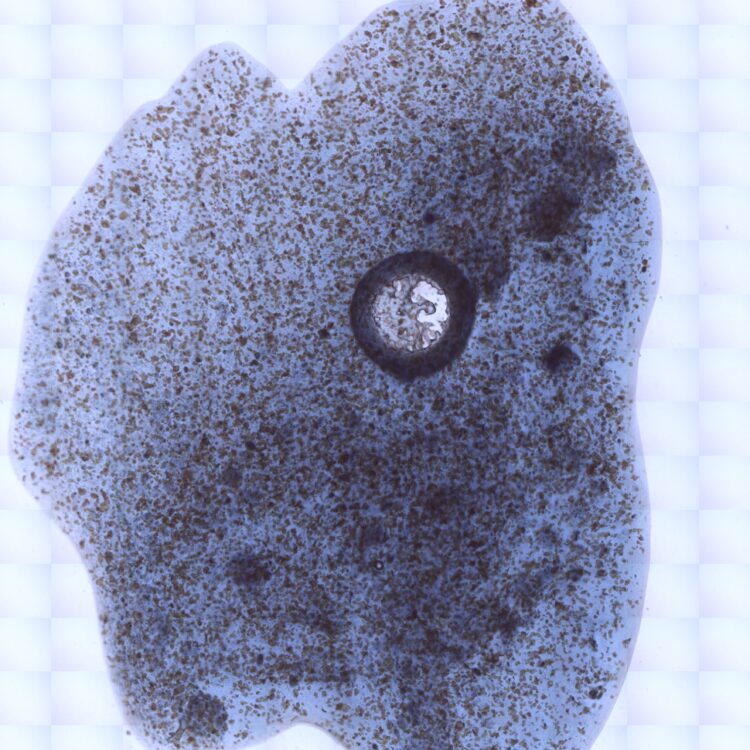
Samples can be viewed as a single field image or a multi image (which provides a broad area image synthesized from a collection of single field images), obtained using the automatic XYZ stage.IQ Monitor can be used to survey the spectral data in a single field or multi image for potential measurement points, which can then be registered for automatic measurement using either the XYZ stage or IQ Mapping.During mapping measurement, the spectra being acquired, together with a functional group false-color mapping image, can be displayed in real time. The spectral data and one or more sample images can be saved together in a single file, which can be opened in the IR Microscope Analysis software for further analysis.

Observation

FocusNAV

Automatic focus adjustment to optimize the optical image for sample measurement.

ViewNAV

Automatic brightness adjustment to optimize the optical image for sample measurement.

Digital Zoom

Digital Zoom can be used to observe details at a higher magnification.
Magnifications: 25%, 50%, 100%, 150%, 200%, 250%, 300%, 350%, 400%, 450%, or 500%.

Optical Zoom

Optical Zoom can be used to achieve higher quality and clarity than Digital Zoom.
Magnifications: 0.6x, 1.0x, or 2.0x.

Multi Image

Create a Multi Image to observe an area larger than the Standard (Preview) Image by stitching together multiple optical images. Click the “Add Multi Image” tool button and select the number of optical images to acquire (3 x 3, 5 x 5, or 7 x 7) around the current position or set a specified area to image based on the x and y coordinates of the automatic XYZ stage. Additional images can be added to a Multi Image to make the optical image even larger. Navigate the Multi Image to look for areas of interest, then use IQ Monitor to view a preview of the current position’s spectrum to identify potential measurement points.

Custom Multi Image

Select a specified area to image based on the x and y coordinates of the automatic XYZ stage or add additional optical images to an already existing multi image to create a custom multi image.

Navigation

Thumbnail Display

When using the automatic XYZ stage, potential measurement positions can be registered as thumbnail images. At any point, the stage can be returned to any registered position by clicking the thumbnail image.

Sub-Map Display

An illustration of the sample holder that can be used to immediately identify the current position of the automatic XYZ stage. The coarse positioning of the stage is made by double-clicking an arbitrary position on the sub-map. An optical image can be overlaid on the sub-map to view the entire stage and the position of any target.

Multi-Window Display

By displaying a zoom image and a multi image simultaneously, the user can view the entire image and a detailed image in a single view, so that the areas of interest in the sample can be registered as measurement points.

Mapping

IQ Monitor

IQ Monitor allows for simultaneous observation of the chemical spectrum and observed sample image to check data quality for determining measurement points before acquisition. Using a high-resolution CMOS camera, a high-quality microscopic image is displayed on the PC monitor and recorded in the data file.

IQ Mapping™

IQ Mapping™ changes the measurement position by moving the aperture around the field of view of the objective, allowing difficult samples to be measured without worrying about sample area limitations or damaging delicate samples.

A Peak Calculation, such as peak height or peak area, can be calculated during IQ Mapping to automatically create a false-color chemical image based on a specific functional group. The chemical image is continuously updated after each spectrum is acquired, providing a complete false-color map once the analysis has finished.

Imaging

FTIR imaging is a technique used to visualize the chemical distribution of compounds in a sample by combining spectral information from FTIR spectroscopy with spatial information from microscopy. An optical image of the sample is taken with a microscope and areas of interest are registered as measurement points, which are overlaid on the optical image. IR spectra of the measurement points are collected by a FTIR spectrometer, with each spectrum corresponding to a specific area in the optical image. The spectra can then be analyzed to identify what compounds are present in the sample based on specific functional groups. Colors are assigned to unique compounds and their intensities represent the presence or concentration of that compound. The chemical image can be overlaid on the optical image to visualize what compounds are present in the sample and how they are distributed.

SearchNAV

SearchNAV automatically recognizes measurement points based on size, shape, color, and/or contrast, even while moving the sample stage. Measurement points are displayed on the observed image and can be registered by clicking the Search button. The aperture size is set automatically according to the Microscope Parameters and batch processing of the identified measurement positions is performed automatically.

Advanced SearchNAV (ASN)

Advanced SearchNAV (ASN) is an optional extension to the standard SearchNAV function. ASN automatically performs a library search or spectral classification for samples detected using SearchNAV after measurement and displays the qualitative results on top of the measurement position.

Integrated Data File with Spectrum and Sample Image

The measured spectral data which is linked with the optical image and can be saved as a file together, each data process utilizing the measurement data and the optical image is available when performing the analysis.