IRT

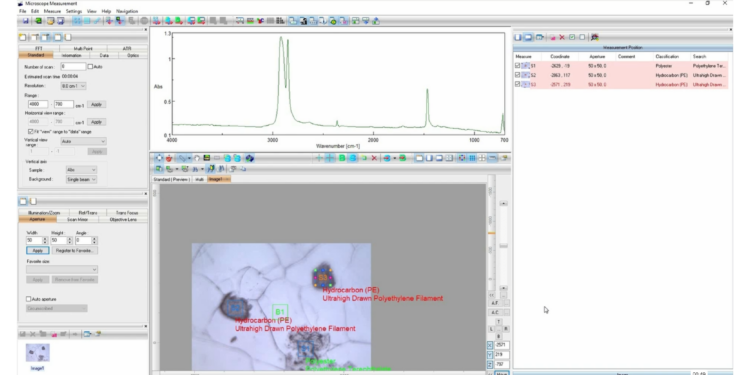
IR Microscope Imaging Analysis Software

Spectra ManagerTM Micro Imaging Analysis Program

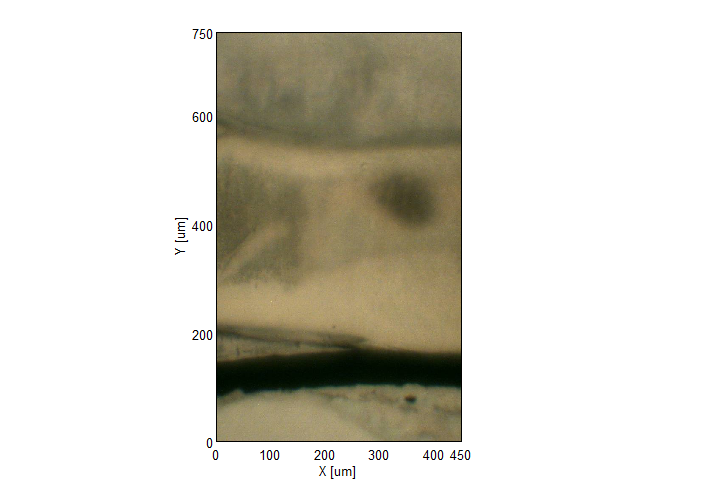
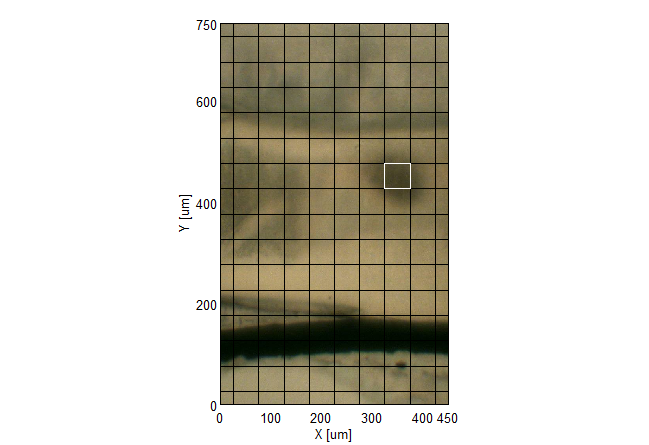
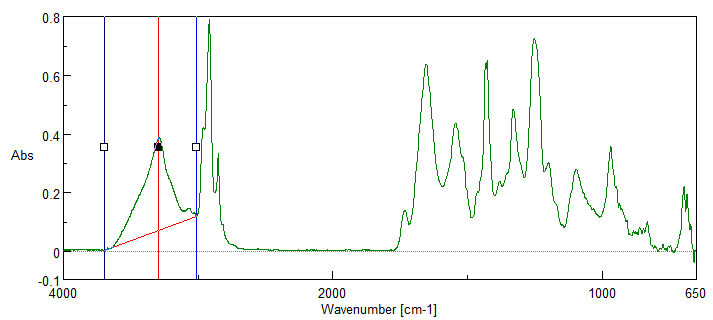
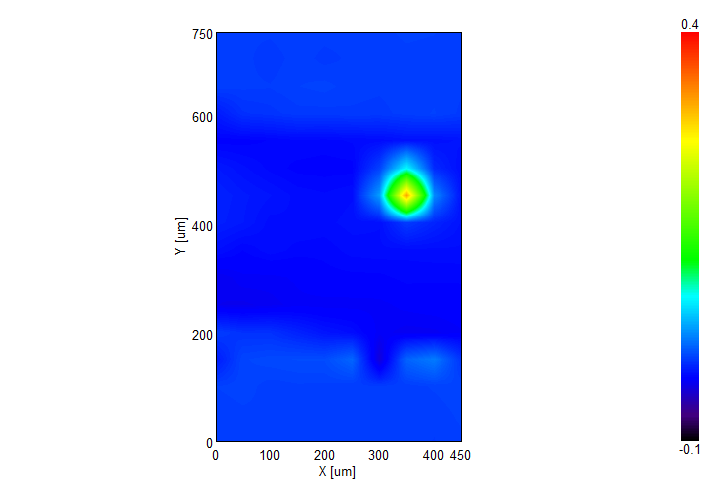
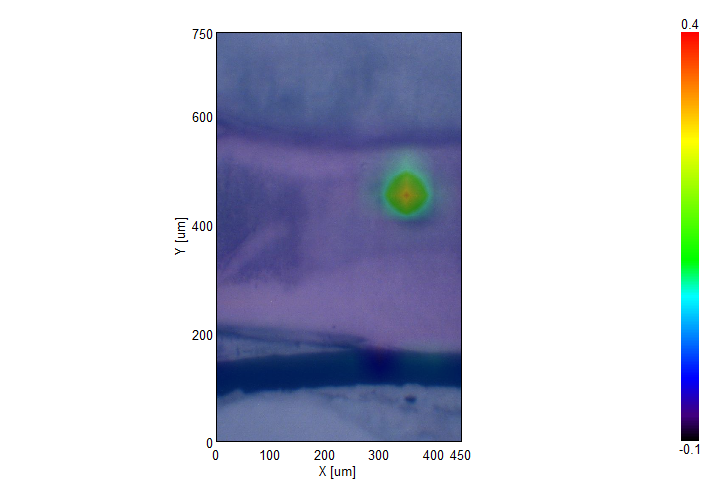
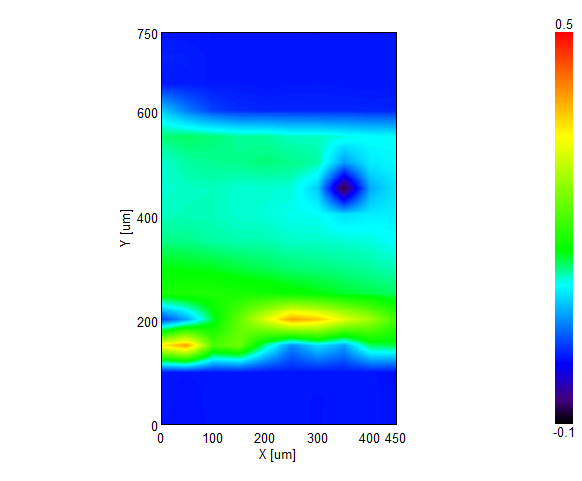
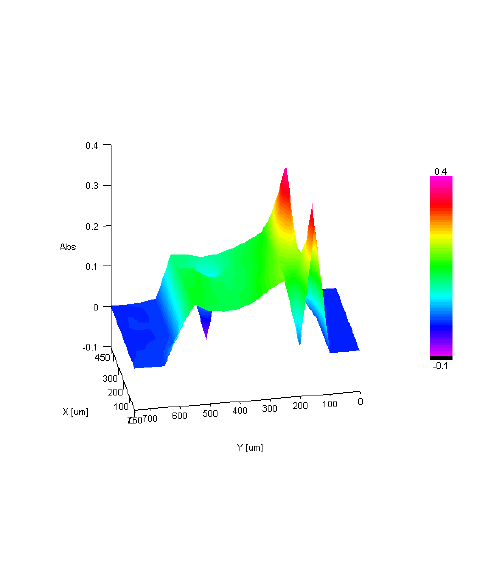
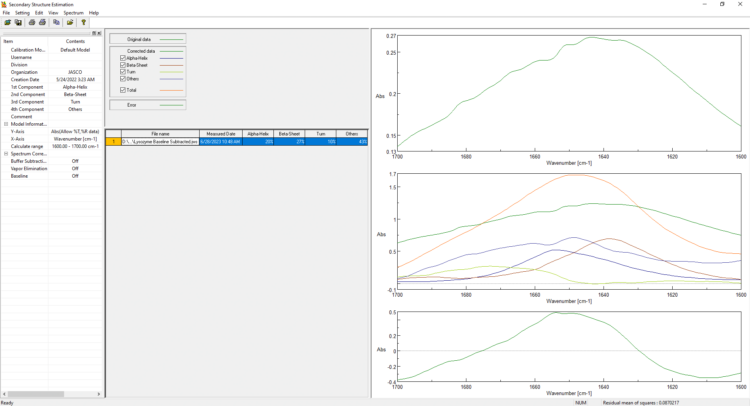
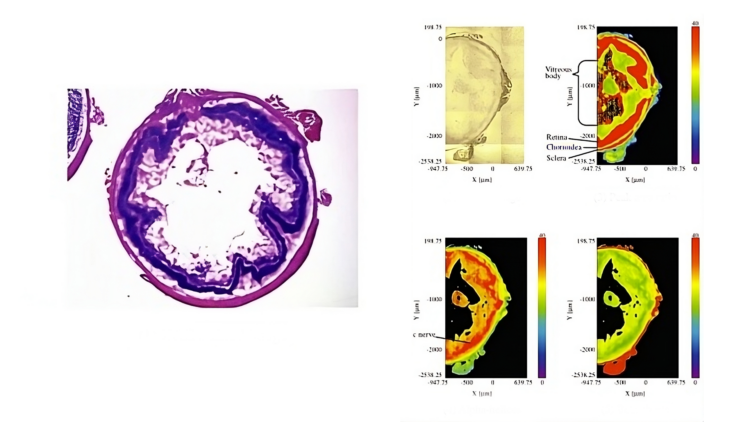
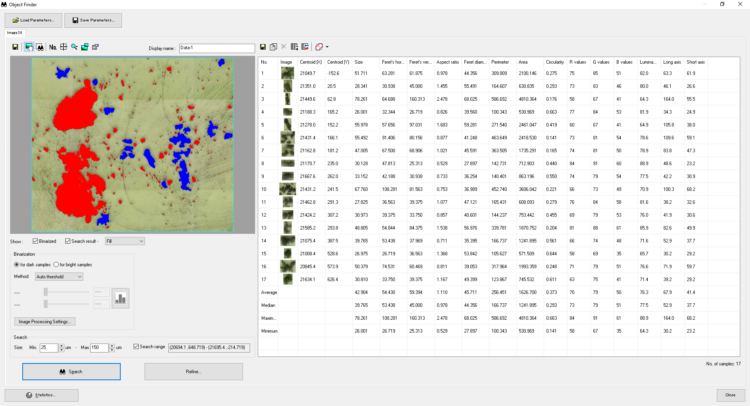
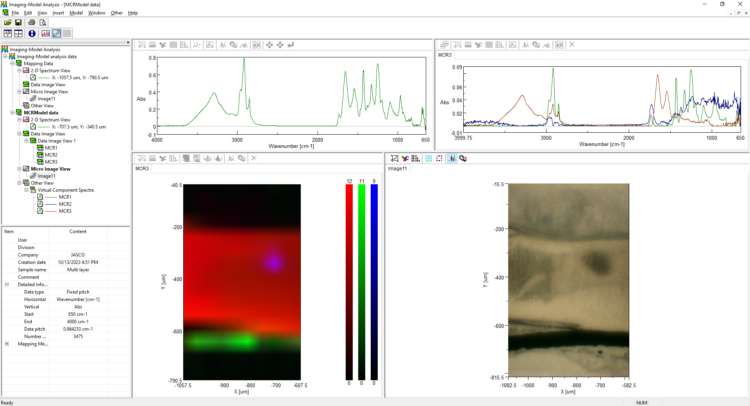
IR Microscope Imaging Analysis is used to perform post-measurement qualitative and quantitative analysis on spectral data measured obtained from the IRT- Series of FTIR microscopes; this powerful software can be used to analyze multi-data arrays from single point to complex three-dimensional measurement maps. The user interface is highly-configurable to display only the tools, data necessary for the user’s requirements – spectral data, optical image and data representations in two and three dimensions can all be displayed in different views on the screen simultaneously.

Analysis Wizard

The Analysis Wizard guides the user through a simple-to-follow sequence with advice on optimizing parameters. Using the data processing sequence, the spectrum can be truncated to the area of interest and a noise reduction can be performed to make it easier to identify the peaks. If necessary, a baseline correction can be made. The user can adjust the data processing parameters that are applied to each spectrum in the data matrix. The final step is to identify either the peaks of the functional groups of interest (using peak area or height), or identifying the principal components by performing Multivariate Curve Resolution (MCR) analysis on the entire data matrix; MCR can elucidate principal components without the need for reference spectra. By overlaying the chemical image directly on the optical image, a composite image reveals the chemical distribution in the sample, which can be adjusted by the user to better observe the chemical distribution on the optical image.

Sequence for Creating a Chemical Map

An optical image of the sample microscope position when the mapping data was measured.

Mapping data measurement points overlaid on top of the optical image.

A two-point base (manual) peak height calculation of the peak at 3285.25 cm-1.

A chemical image that was generated based on the peak height calculation of the peak at 3285.25 cm-1.

The chemical image overlaid on top of the optical image with 60% transparency to create a composite image showing the chemical distribution throughout the sample.

Selecting the Format for Data Display

The analysis program can display the chemical image in a range of styles for the user to visualize the location of functional groups within the sample.

MCR Model

MCR Model creates a relative concentration distribution by extracting the principal components automatically from the measured spectra using Multivariate Curve Resolution (MCR). The chemical image can be obtained in a very short time without the risk of neglecting any components contained in the sample. It is also possible to identify the components by searching the spectra of the principal components against a spectral database. Each calculated principal spectrum is displayed in the Misc. Data View while the chemical image with the score distribution of principal spectra at each point is displayed in the Data Image View.