Measurement of NIR CD Spectra of Nickel Titrate and Limonene using a J-1500 Circular Dichroism Spectrometer
January 5, 2024
 Download This Application
Introduction
In the near-infrared (NIR) region, observed CD spectra are a result of the combination and overtone vibrational modes of the O-H and C-H transitions (NIR-VCD), as well as the d-d transition of metallo-proteins and metal complexes (NIR-ECD). NIR-ECD spectra of metallo-protein and metal complexes are known to be sensitive to conformations of the metals ligands as well as the configuration around the central metal atom, which is used for structural analysis of these molecules.1 For NIR-VCD, theories and calculation methods to interpret the NIR-VCD spectra have been introduced and comparative analysis for many of the spectra have been accomplished.2
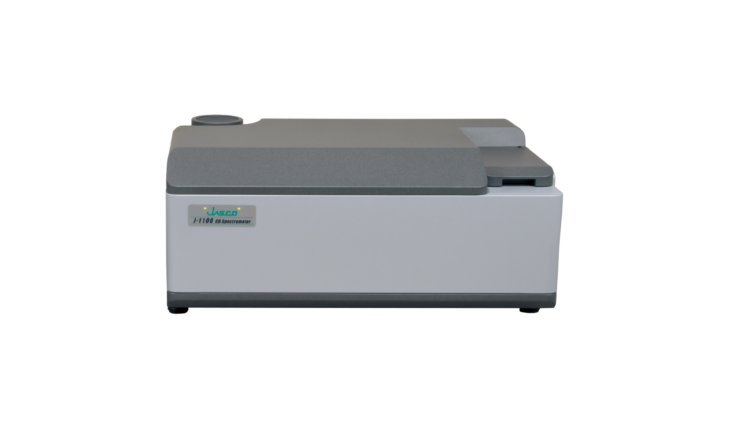
The J-1500 CD spectrometer can be used for spectral measurements into the NIR region (up to 1600 nm) using an extended wavelength range light source and detector. In this configuration, the instrument can be used for NIRVCD measurements of vibrational transitions and NIR-ECD measurements of metal complexes. The J-1500 can also be used to measure the ECD spectrum in the UV region, primarily for the study of biological samples.
This application notes demonstrates the use of the J-1500 CD spectrometer to probe vibrational and electronic transitions of nickel tartrate solution³ and limonene² in the NIR region of the spectrum.
Experimental
| Measurement conditions: nickel tartrate | ||
|---|---|---|
| NIR UV/Visible | NIR | |
| Light source | Xenon lamp | Halogen lamp (optional) |
| Detector | PMT | InGaAs (optional) |
| Measurement range | 235 - 940 nm | 940 - 1600 nm |
| Spectral band width | 1 nm | 16 nm |
| Data acquisition interval | 0.1 nm | 1 nm |
| Path length | 10 mm | 0.5 mm |
| Scan speed | 200 nm/min | |
| Response time | 1 sec | |
| Accumulations | 1 time | |
| Gain | 100x (InGaAs detector only) |
| Measurement conditions: limonene | |
|---|---|
| Light source | Halogen lamp (optional) |
| Detector | InGaAs (optional) |
| Measurement range | 1100 - 1350 nm |
| Measurement mode | CD/DC, UV single (Abs)/td> |
| Spectral band width | 16 nm |
| Data acquisition interval | 0.1 nm |
| Scan speed | 100 nm/min |
| Response time | 2 sec |
| Accumulations | 16 times |
| Gain | 100x |
A nickel tartrate solution was prepared by mixing 0.24 M nickel sulfate solution and 0.36 M sodium potassium tartrate solution with a 1:1 volume ratio. R-(+) and S-(-) limonene were used neat.
Keywords
260-CD-0022, J-1500, electronic circular dichroism, vibrational circular dichroism, near infrared region, nickel tartrate, limonene, NIR-ECD, NIR-VCD, metal complexes, chemical
Results
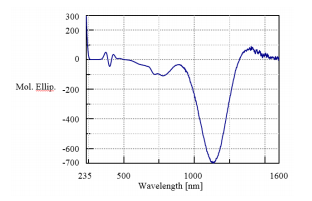
A UV/Vis and NIR CD spectrum of nickel tartrate solution is shown in Figure 1. The vertical axis is converted to molar ellipticity to compensate for the difference in path length for the spectra collected in the UV/Vis region and NIR region. The spectra can be measured with high sensitivity up to 1600 nm, although some absorption from H2O is observed in the region above 1400 nm.
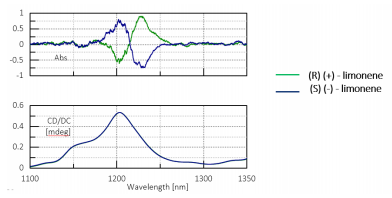
The absorption and CD spectra derived from the double overtone of the C-H vibrational transition of R-(+) and S-(-)-limonene are shown in Figure 2. Racemic limonene was used as the baseline measurement for the CD spectrum. Limonene was measured with a pathlength of 10 mm and 2 mm because there is no appropriate solvent to serve as the baseline for liquid limonene at room temperature in the absorption spectrum. The difference spectrum (absorption equivalent to 8 mm pathlength) is multiplied by 1.25 and converted to an absorption equal to a 10 mm pathlength. The very weak CD signal below 1 mdeg can therefore be measured with high sensitivity.
Conclusion
This application note demonstrates that the J-1500 CD spectrometer can be used to probe vibrational transitions in the near infrared region of the CD spectrum with high sensitivity.
References
1. Eaton, W. A., Palmer, G., Fee, J. A., Kimura, T., and W. Lovenberg, PNAS (1971), 68, 12, 3015-3020.
2. Abbate, S., Castiglioni, E., Gangemi, F., Gangemi, R., and G. Longhi, Chirality (2009), 21, 1, 242-252.
3. Konno, T., Meguro, H., Murakami, T., and M. Hatano, Chemistry Letters (1981), 953-956.
Featured Products:

Measurement of NIR CD Spectra of Nickel Titrate and Limonene using a J-1500 Circular Dichroism Spectrometer
Introduction
In the near-infrared (NIR) region, observed CD spectra are a result of the combination and overtone vibrational modes of the O-H and C-H transitions (NIR-VCD), as well as the d-d transition of metallo-proteins and metal complexes (NIR-ECD). NIR-ECD spectra of metallo-protein and metal complexes are known to be sensitive to conformations of the metals ligands as well as the configuration around the central metal atom, which is used for structural analysis of these molecules.1 For NIR-VCD, theories and calculation methods to interpret the NIR-VCD spectra have been introduced and comparative analysis for many of the spectra have been accomplished.2
The J-1500 CD spectrometer can be used for spectral measurements into the NIR region (up to 1600 nm) using an extended wavelength range light source and detector. In this configuration, the instrument can be used for NIRVCD measurements of vibrational transitions and NIR-ECD measurements of metal complexes. The J-1500 can also be used to measure the ECD spectrum in the UV region, primarily for the study of biological samples.
This application notes demonstrates the use of the J-1500 CD spectrometer to probe vibrational and electronic transitions of nickel tartrate solution³ and limonene² in the NIR region of the spectrum.
Experimental
| Measurement conditions: nickel tartrate | ||
|---|---|---|
| NIR UV/Visible | NIR | |
| Light source | Xenon lamp | Halogen lamp (optional) |
| Detector | PMT | InGaAs (optional) |
| Measurement range | 235 - 940 nm | 940 - 1600 nm |
| Spectral band width | 1 nm | 16 nm |
| Data acquisition interval | 0.1 nm | 1 nm |
| Path length | 10 mm | 0.5 mm |
| Scan speed | 200 nm/min | |
| Response time | 1 sec | |
| Accumulations | 1 time | |
| Gain | 100x (InGaAs detector only) |
| Measurement conditions: limonene | |
|---|---|
| Light source | Halogen lamp (optional) |
| Detector | InGaAs (optional) |
| Measurement range | 1100 - 1350 nm |
| Measurement mode | CD/DC, UV single (Abs)/td> |
| Spectral band width | 16 nm |
| Data acquisition interval | 0.1 nm |
| Scan speed | 100 nm/min |
| Response time | 2 sec |
| Accumulations | 16 times |
| Gain | 100x |
A nickel tartrate solution was prepared by mixing 0.24 M nickel sulfate solution and 0.36 M sodium potassium tartrate solution with a 1:1 volume ratio. R-(+) and S-(-) limonene were used neat.
Results
A UV/Vis and NIR CD spectrum of nickel tartrate solution is shown in Figure 1. The vertical axis is converted to molar ellipticity to compensate for the difference in path length for the spectra collected in the UV/Vis region and NIR region. The spectra can be measured with high sensitivity up to 1600 nm, although some absorption from H2O is observed in the region above 1400 nm.
The absorption and CD spectra derived from the double overtone of the C-H vibrational transition of R-(+) and S-(-)-limonene are shown in Figure 2. Racemic limonene was used as the baseline measurement for the CD spectrum. Limonene was measured with a pathlength of 10 mm and 2 mm because there is no appropriate solvent to serve as the baseline for liquid limonene at room temperature in the absorption spectrum. The difference spectrum (absorption equivalent to 8 mm pathlength) is multiplied by 1.25 and converted to an absorption equal to a 10 mm pathlength. The very weak CD signal below 1 mdeg can therefore be measured with high sensitivity.
Conclusion
This application note demonstrates that the J-1500 CD spectrometer can be used to probe vibrational transitions in the near infrared region of the CD spectrum with high sensitivity.
Keywords
260-CD-0022, J-1500, electronic circular dichroism, vibrational circular dichroism, near infrared region, nickel tartrate, limonene, NIR-ECD, NIR-VCD, metal complexes, chemical
References
1. Eaton, W. A., Palmer, G., Fee, J. A., Kimura, T., and W. Lovenberg, PNAS (1971), 68, 12, 3015-3020.
2. Abbate, S., Castiglioni, E., Gangemi, F., Gangemi, R., and G. Longhi, Chirality (2009), 21, 1, 242-252.
3. Konno, T., Meguro, H., Murakami, T., and M. Hatano, Chemistry Letters (1981), 953-956.