Novel Injection Method in Preparative Supercritical Fluid Chromatography
August 24, 2022
 Download This Application
Introduction
We have developed a novel injection method for preparative supercritical fluid chromatography (Prep-SFC), which is very effective to improve separation efficiency when a large volume sample is loaded onto a column for higher productivity. We name this method Dual Line Injection (DLI) method*, of which unit includes a bypass line in the sample injector. The method is especially effective for the peaks having shorter retention times.
Chiral separation of trans-stilbene oxide recemate was performed to evaluate the DLI method. The purities of both enantiomers were calculated and compared with those by the conventional direct injection method. Peak leading was improved and the purity of the second fraction was increased from 87 ± 1% to 98 ± 1%.
* Patent pending
Recently, fractionation and purification by Prep-SFC has been widely used as it offers low running cost, high-throughput and environmentally friendly green chemical process. Especially, it is effective for the separation and fractionation of racemates of chiral compounds, which are important ingredients for medicines.
In 1995, JASCO’s group successfully demonstrated preparative chiral separation by prep-SFC with stack injections, and showed the method was very efficient and suitable for fractionation of chiral compounds 1). Recently, JASCO’s group reported prep-SFC with circular dichroism (CD) detection. They showed that g-factor, which is a signal of CD signal divided by UV signal, triggered fractionation method was excellent to accurately control the fractionation timing, offering collection of higher enantiomeric purity 2).
However, prep-SFC itself has some issues of separation efficiency and peak purities when a large amount of sample is injected onto a column. That is the column is overloaded and equilibrium between sample solute, stationary phase and solvent no longer hold, resulting in severe leading of peaks. Further in SFC, a strong solvent is used to obtain a high concentration sample solution, therefore, the separation of compounds of interest is affected by the sample solvent and it often causes the peak leading and broadening. Especially it was significant for the peaks having shorter retention times.
We have developed a novel injection method to solve these problems. In this report, we demonstrate a highly efficient fractionation with Dual Line Injection (DLI) method. We applied the method to the separation and purification of racemic transstilbene oxide.
Experimental
Materials and Chemicals
A prep-SFC column, Princeton SFC SILICA 60A 10u, 21.2 mm ID x 250 mmL, was purchased from Princeton Chromatography Inc., NJ, USA. An analytical chiral column CHIRALPAK IA (4.6 mm ID x 250 mmL) and a preparative column CHIRALPAK IA (20 mm ID x 250 mmL) were purchased from Daicel Chemical Industries, Ltd., Osaka, Japan.
Carbon dioxide (99.99 %) was supplied by Nippon Tansan, Co., Ltd., Tokyo, Japan. HPLC-grade methanol used as a modifier solvent was purchased from Kanto Chemical Co., Inc., Tokyo Japan. Trans-stilbene oxide was purchased from Tokyo Chemical Industry Co., Ltd. Tokyo, Japan. Ethyl 4-hydroxybenzoate and Caffeine were purchased from Wako Pure Chemicals Osaka, Japan.
Apparatus
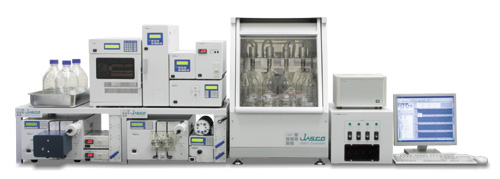
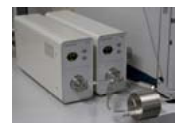
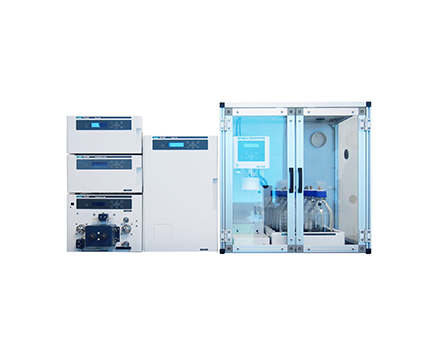
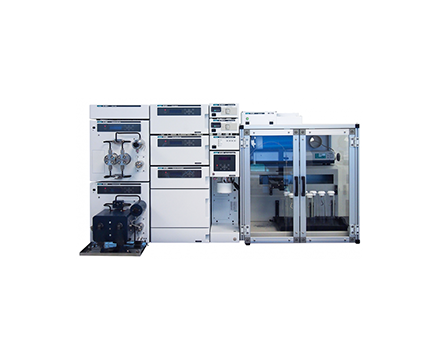
Figure 1 shows the appearance of JASCO Prep-SFC system with a large volume injector (LVI) used through out the experiment. Figure 2 shows the appearance of the large Volume Injector (LVI) included in the system.
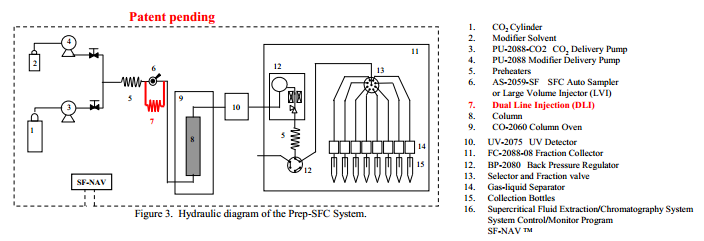
Components are listed in the figure legend. The DLI method dilutes the sample solvent with the mobile phase fluid when the sample is merged with the solvent of the bypass line. The bypass line also prevents the pressure surge when the injector valve is turned. The SF-NAV software managed the total system control.
Results
Determination of dilution ratio in the DLI system
It is important to determine the dilution ratio when the injected sample is merged with the mobile phase fluid (a mixture of CO2 and modifier solvent) in the bypass line. Because the DLI system takes a part in carrying a sample into the main line of the fluid having weaker elution power by diluting the bypass line fluid and eliminating the peak slipping in a column by the sample solvent.
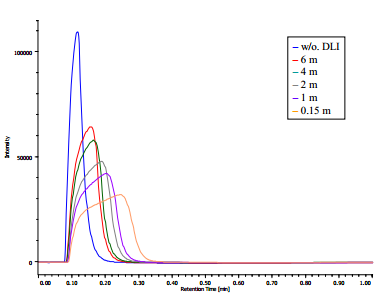
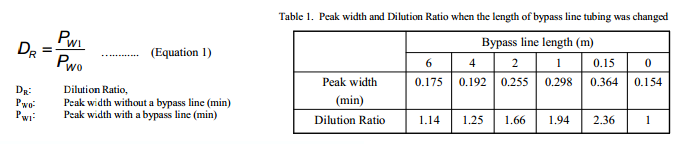
We measured the dilution ratios with different lengths of bypass line tubes by flow injection method. Figure 4 shows the flow injection traces when tubes with different lengths were used. A peak width becomes larger as the length of bypass line tube becomes shorter. This shows that the dilution ratio changed according to the flow resistance of bypass line tube. Peak widths (peak startend time) of the traces shown in Figure 4 were calculated and the dilution ratios were calculated using Equation 1. Table 1 shows the peak widths and the calculated dilution ratios with various lengths of the tube. We selected the tube length that gives the dilution ratio of 1.2 to 2.0 that gave the good results. The length should be changed according to the solubility of the sample in the solvent to obtain the best results.
Definition of Dilution Ratio
The dilution ratio was calculated from both the peak width when connected the bypass line and normal injection the peak width (Equation 1). Table 1 showed that peak width and dilution ratio when the bypass line length changed.
Comparison of peak widths
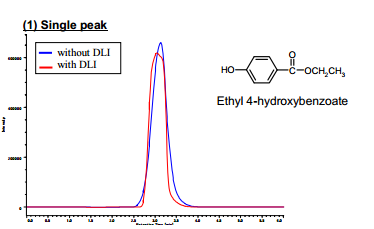
We compared the peak widths with and without the DLI method. First, we evaluated the peak width and asymmetry factor by using a silica column and ethyl 4-hydroxybenzoate as a test sample. The obtained asymmetry factor of the peaks are listed in Table 2.
As shown in Figure 5, peak leading was drastically reduced and even exhibited a little tailing. Therefore, the peak width was reduced from 2.0 to 1.5 and the asymmetry factor was improved from 0.85 to 1.09 as shown in Table 2.
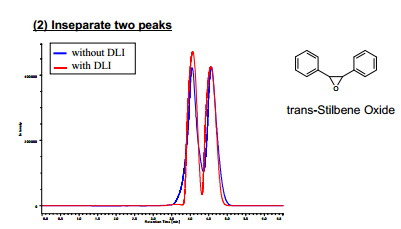
Next, we evaluated the degree of separation by the chiral separation of trans-stilbene oxide using a preparative chiral column. Figure 6 shows the obtained chromatograms with and without the DLI. To express the degree of separation, the resolution (Rs) is generally used. However, in our case, the resolution could not be applied because it is expressed by (the difference in retention time) / (average of peak widths). As shown in Figure 6, the difference in retention time and the peak widths are similar in both chromatograms and Rs could not differentiate the degree of separation. Therefore, we introduced a formula that expresses the degree of separation in such a case. We defined a factor of degree of separation DS as described in the following paragraph.
Table 3 shows the peak start-end time of two adjacent peaks and the factor of degree of separation DS. As shown in Figure 6, the height of valley becomes lower because leading for each enantiomer peak was drastically reduced. Therefore, the peak start-end time was reduced from 2.5 to 1.7 and the factor DS was increased from 30.1 to 88.1 as shown in Table 3.
| Peak width (start-end time) (min) | Asymmetry factor | |
|---|---|---|
| without DLI | 2.0 | 0.85 |
| with DLI | 1.5 | 1.09 |
| Peak width (start-end time) (min) | Asymmetry factor | |
|---|---|---|
| without DLI | 2.5 | 30.1 |
| with DLI | 1.7 | 88.1 |
Definition of Factor Degree of Separation (DS)
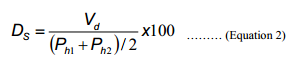 As expressed by Equation 2, the factor of Degree of Separation DS is defined as a value of a valley depth divided by a mean of heights of two adjacent peaks, assuming that these two peaks have similar heights. By this definition, one can evaluate the degree of separation between incomplete separation that is often found in preparative chromatography.
Relationship between the factor of degree of separation DS and the dilution ratio
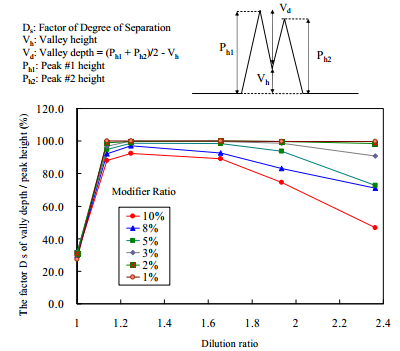
The factor of degree of separation depends DS on the solubility of the sample in the fluid (a mixture of CO2 and modifier solvent). Therefore, when the modifier solvent composition in the mobile phase is changed, the dilution ratio (calculated in the previous section) should be changed as well.
We evaluated the relationship between the DS and the dilution ratio when the modifier solvent composition was changed. The results are shown in Figure 7. As shown, when the dilution ratio is in the range from 1.1 to 1.8, the DS becomes nearly 100 %, the peaks are almost baseline separated. The DS becomes more than 1.8, the factor DSbecomes smaller.
The maxima in factors DS, observed with lower modifier compositions than 3%, can be attributed to two phenomena. One is that if the dilution ratio DR is less than 1.2, the sample solution is not diluted enough to prevent slipping in the column by the sample solvent, causing peak leading. The other is that if dilution ratio DR is more than 1.8, the sample solution is too diluted and injected as too big a sample volume onto the column, causing band broadening.
Considering the above reasons, a proper dilution ratio and a modifier solvent composition should be chosen to obtain better separation and higher throughput.
Comparing the purities of fractions
We compared between the fraction purities measured by the system with the DLI system and those by the system without the DLI. The trans-stilbene oxide we compared the purities of fractions measured by this system with the DLI system and those by the system without the DLI. The trans-stilbene oxide racemate was separated on the preparative CHIRALPAK IA column (20 mm ID x 250 mmL) and each enantiomer was fractionated. The fractions were analyzed using the analytical CHIRALPAK IA column (4.6 mm ID x 250 mmL) to measure the purities.
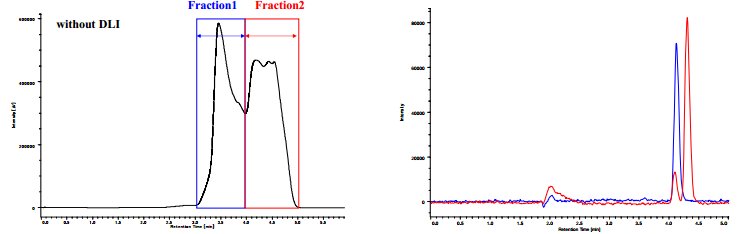
Figure 8A shows the chromatogram of preparative separation of trans-stilbene oxide without DLI system. Fractionation timing is indicated on the chromatogram. As shown in this figure, the peaks are very distorted and two peaks were fused. Figure 8B shows the overlaid analytical chromatograms of collected fractions in the preparative SFC shown in Figure 8A. The purities were calculated to be 99±1% for Fraction 1 and 87 ±1% for Fraction 2, respectively, from these chromatograms. It is obvious that Fraction 2 is contaminated by the Fraction 1 component.
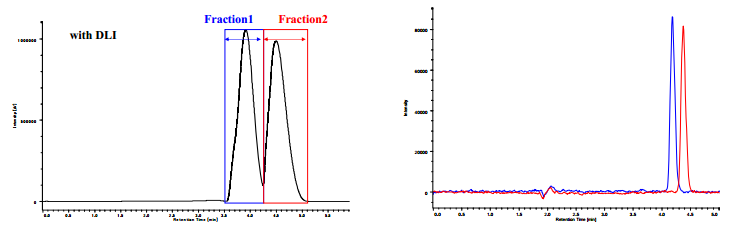
Figure 9A shows the chromatogram of preparative separation with DLI system. Fractionation timing is indicated on the chromatogram. As can be seen in this figure, the peak shapes and separation are excellent compared to those in Figure 8. Figure 9B shows the overlaid analytical chromatograms of collected fractions in the preparative SFC shown in Figure 9A. The purities were calculated to be 99±1% for Fraction 1 and 98 ±1% for Fraction 2, respectively, from these chromatograms. It is remarkable that the purity of Fraction 2 was increased from 87% to 98%.
These results show that the DLI method is very useful to improve the peak shape and the degree of separation of adjacent peaks and offers higher productivity and purity in preparative SFC separation.
Conclusion
- A novel injection method, Dual Line Injection (DLI), has successfully been developed as a powerful method that offers higher productivity and purity in Prep-SFC.
- The DLI method improves peak shapes of adjacent peaks and the degree of separation. It is especially effective for the peaks having shorter retention times.
- We applied the method to the chiral separation and fractionation of trans-stilbene oxide racemate. The purity of the second fraction was increased from 87 ± 1% to 98 ± 1%.
Featured Products:
-
Supercritical fluid extraction (SFE) for analytical to liter scale
SFE Systems
-
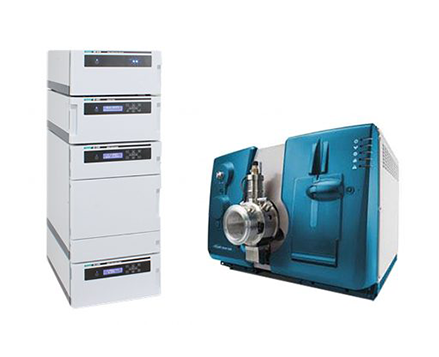
Tandem LC-MS
-
SFC-4000 Preparative, Semi-Preparative, and Hybrid SFC systems for preparative scale purifications.
Preparative SFC

Novel Injection Method in Preparative Supercritical Fluid Chromatography
Introduction
We have developed a novel injection method for preparative supercritical fluid chromatography (Prep-SFC), which is very effective to improve separation efficiency when a large volume sample is loaded onto a column for higher productivity. We name this method Dual Line Injection (DLI) method*, of which unit includes a bypass line in the sample injector. The method is especially effective for the peaks having shorter retention times.
Chiral separation of trans-stilbene oxide recemate was performed to evaluate the DLI method. The purities of both enantiomers were calculated and compared with those by the conventional direct injection method. Peak leading was improved and the purity of the second fraction was increased from 87 ± 1% to 98 ± 1%.
* Patent pending
Recently, fractionation and purification by Prep-SFC has been widely used as it offers low running cost, high-throughput and environmentally friendly green chemical process. Especially, it is effective for the separation and fractionation of racemates of chiral compounds, which are important ingredients for medicines.
In 1995, JASCO’s group successfully demonstrated preparative chiral separation by prep-SFC with stack injections, and showed the method was very efficient and suitable for fractionation of chiral compounds 1). Recently, JASCO’s group reported prep-SFC with circular dichroism (CD) detection. They showed that g-factor, which is a signal of CD signal divided by UV signal, triggered fractionation method was excellent to accurately control the fractionation timing, offering collection of higher enantiomeric purity 2).
However, prep-SFC itself has some issues of separation efficiency and peak purities when a large amount of sample is injected onto a column. That is the column is overloaded and equilibrium between sample solute, stationary phase and solvent no longer hold, resulting in severe leading of peaks. Further in SFC, a strong solvent is used to obtain a high concentration sample solution, therefore, the separation of compounds of interest is affected by the sample solvent and it often causes the peak leading and broadening. Especially it was significant for the peaks having shorter retention times.
We have developed a novel injection method to solve these problems. In this report, we demonstrate a highly efficient fractionation with Dual Line Injection (DLI) method. We applied the method to the separation and purification of racemic transstilbene oxide.
Experimental
Materials and Chemicals
A prep-SFC column, Princeton SFC SILICA 60A 10u, 21.2 mm ID x 250 mmL, was purchased from Princeton Chromatography Inc., NJ, USA. An analytical chiral column CHIRALPAK IA (4.6 mm ID x 250 mmL) and a preparative column CHIRALPAK IA (20 mm ID x 250 mmL) were purchased from Daicel Chemical Industries, Ltd., Osaka, Japan.
Carbon dioxide (99.99 %) was supplied by Nippon Tansan, Co., Ltd., Tokyo, Japan. HPLC-grade methanol used as a modifier solvent was purchased from Kanto Chemical Co., Inc., Tokyo Japan. Trans-stilbene oxide was purchased from Tokyo Chemical Industry Co., Ltd. Tokyo, Japan. Ethyl 4-hydroxybenzoate and Caffeine were purchased from Wako Pure Chemicals Osaka, Japan.
Apparatus
Figure 1 shows the appearance of JASCO Prep-SFC system with a large volume injector (LVI) used through out the experiment. Figure 2 shows the appearance of the large Volume Injector (LVI) included in the system.
Components are listed in the figure legend. The DLI method dilutes the sample solvent with the mobile phase fluid when the sample is merged with the solvent of the bypass line. The bypass line also prevents the pressure surge when the injector valve is turned. The SF-NAV software managed the total system control.
Results
Determination of dilution ratio in the DLI system
It is important to determine the dilution ratio when the injected sample is merged with the mobile phase fluid (a mixture of CO2 and modifier solvent) in the bypass line. Because the DLI system takes a part in carrying a sample into the main line of the fluid having weaker elution power by diluting the bypass line fluid and eliminating the peak slipping in a column by the sample solvent.
We measured the dilution ratios with different lengths of bypass line tubes by flow injection method. Figure 4 shows the flow injection traces when tubes with different lengths were used. A peak width becomes larger as the length of bypass line tube becomes shorter. This shows that the dilution ratio changed according to the flow resistance of bypass line tube. Peak widths (peak startend time) of the traces shown in Figure 4 were calculated and the dilution ratios were calculated using Equation 1. Table 1 shows the peak widths and the calculated dilution ratios with various lengths of the tube. We selected the tube length that gives the dilution ratio of 1.2 to 2.0 that gave the good results. The length should be changed according to the solubility of the sample in the solvent to obtain the best results.
Definition of Dilution Ratio
The dilution ratio was calculated from both the peak width when connected the bypass line and normal injection the peak width (Equation 1). Table 1 showed that peak width and dilution ratio when the bypass line length changed.
Comparison of peak widths
We compared the peak widths with and without the DLI method. First, we evaluated the peak width and asymmetry factor by using a silica column and ethyl 4-hydroxybenzoate as a test sample. The obtained asymmetry factor of the peaks are listed in Table 2.
As shown in Figure 5, peak leading was drastically reduced and even exhibited a little tailing. Therefore, the peak width was reduced from 2.0 to 1.5 and the asymmetry factor was improved from 0.85 to 1.09 as shown in Table 2.
Next, we evaluated the degree of separation by the chiral separation of trans-stilbene oxide using a preparative chiral column. Figure 6 shows the obtained chromatograms with and without the DLI. To express the degree of separation, the resolution (Rs) is generally used. However, in our case, the resolution could not be applied because it is expressed by (the difference in retention time) / (average of peak widths). As shown in Figure 6, the difference in retention time and the peak widths are similar in both chromatograms and Rs could not differentiate the degree of separation. Therefore, we introduced a formula that expresses the degree of separation in such a case. We defined a factor of degree of separation DS as described in the following paragraph.
Table 3 shows the peak start-end time of two adjacent peaks and the factor of degree of separation DS. As shown in Figure 6, the height of valley becomes lower because leading for each enantiomer peak was drastically reduced. Therefore, the peak start-end time was reduced from 2.5 to 1.7 and the factor DS was increased from 30.1 to 88.1 as shown in Table 3.
| Peak width (start-end time) (min) | Asymmetry factor | |
|---|---|---|
| without DLI | 2.0 | 0.85 |
| with DLI | 1.5 | 1.09 |
| Peak width (start-end time) (min) | Asymmetry factor | |
|---|---|---|
| without DLI | 2.5 | 30.1 |
| with DLI | 1.7 | 88.1 |
Definition of Factor Degree of Separation (DS)
As expressed by Equation 2, the factor of Degree of Separation DS is defined as a value of a valley depth divided by a mean of heights of two adjacent peaks, assuming that these two peaks have similar heights. By this definition, one can evaluate the degree of separation between incomplete separation that is often found in preparative chromatography.
Relationship between the factor of degree of separation DS and the dilution ratio
The factor of degree of separation depends DS on the solubility of the sample in the fluid (a mixture of CO2 and modifier solvent). Therefore, when the modifier solvent composition in the mobile phase is changed, the dilution ratio (calculated in the previous section) should be changed as well.
We evaluated the relationship between the DS and the dilution ratio when the modifier solvent composition was changed. The results are shown in Figure 7. As shown, when the dilution ratio is in the range from 1.1 to 1.8, the DS becomes nearly 100 %, the peaks are almost baseline separated. The DS becomes more than 1.8, the factor DSbecomes smaller.
The maxima in factors DS, observed with lower modifier compositions than 3%, can be attributed to two phenomena. One is that if the dilution ratio DR is less than 1.2, the sample solution is not diluted enough to prevent slipping in the column by the sample solvent, causing peak leading. The other is that if dilution ratio DR is more than 1.8, the sample solution is too diluted and injected as too big a sample volume onto the column, causing band broadening.
Considering the above reasons, a proper dilution ratio and a modifier solvent composition should be chosen to obtain better separation and higher throughput.
Comparing the purities of fractions
We compared between the fraction purities measured by the system with the DLI system and those by the system without the DLI. The trans-stilbene oxide we compared the purities of fractions measured by this system with the DLI system and those by the system without the DLI. The trans-stilbene oxide racemate was separated on the preparative CHIRALPAK IA column (20 mm ID x 250 mmL) and each enantiomer was fractionated. The fractions were analyzed using the analytical CHIRALPAK IA column (4.6 mm ID x 250 mmL) to measure the purities.
Figure 8A shows the chromatogram of preparative separation of trans-stilbene oxide without DLI system. Fractionation timing is indicated on the chromatogram. As shown in this figure, the peaks are very distorted and two peaks were fused. Figure 8B shows the overlaid analytical chromatograms of collected fractions in the preparative SFC shown in Figure 8A. The purities were calculated to be 99±1% for Fraction 1 and 87 ±1% for Fraction 2, respectively, from these chromatograms. It is obvious that Fraction 2 is contaminated by the Fraction 1 component.
Figure 9A shows the chromatogram of preparative separation with DLI system. Fractionation timing is indicated on the chromatogram. As can be seen in this figure, the peak shapes and separation are excellent compared to those in Figure 8. Figure 9B shows the overlaid analytical chromatograms of collected fractions in the preparative SFC shown in Figure 9A. The purities were calculated to be 99±1% for Fraction 1 and 98 ±1% for Fraction 2, respectively, from these chromatograms. It is remarkable that the purity of Fraction 2 was increased from 87% to 98%.
These results show that the DLI method is very useful to improve the peak shape and the degree of separation of adjacent peaks and offers higher productivity and purity in preparative SFC separation.
Conclusion
- A novel injection method, Dual Line Injection (DLI), has successfully been developed as a powerful method that offers higher productivity and purity in Prep-SFC.
- The DLI method improves peak shapes of adjacent peaks and the degree of separation. It is especially effective for the peaks having shorter retention times.
- We applied the method to the chiral separation and fractionation of trans-stilbene oxide racemate. The purity of the second fraction was increased from 87 ± 1% to 98 ± 1%.