Protein Quantitation using a UV-Visible Spectrophotometer
January 5, 2024
 Download This Application
Introduction
UV-Visible Spectrophotometer
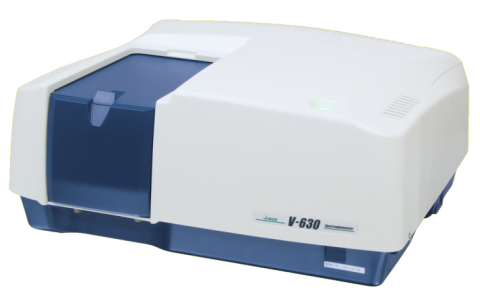
Generally, protein quantitation can be made using a simple UV-Visible spectrophotometer. The V-630 Bio (Figure 1) is a UV-Visible spectrophotometer designed for biochemical analysis. The V-630 Bio includes 6 quantitative methods based on UV absorption spectrophotometry including the Lowry, Biuret, BCA, Bradford, and WST methods.
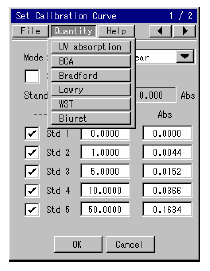
Table 1 (below) shows the features of the six different quantitation methods. As outlined, a method can be selected by reviewing the sample and quantitation range and the presence of possible contaminants. Five of the analysis methods use a chromogenic reaction. Reagent manufacturers produce chromogenic kits for BCA, Bradford or WST with a protocol explaining the relevant measurement procedures *1). Chromogenic reagents for the Lowry and Biuret methods must be prepared by the user. The measurement procedures for the Lowry and Biuret methods differ according to use. For that reason, this application note explains how to create the calibration curves for the Lowry, Biuret and UV absorption analysis methods. Fluctuations in the values depending on the type of proteins and the differences in the concentration ranges calculated as a result of the cell volume *2) were also investigated.
*1) BCA method: BCA Protein Assy Kit – by PIERCE
Bradford method: Protein Quantification Kit – Rapid by DOJINDO
WST method: Protein Quantification Kit – Wide Range by DOJINDO
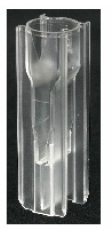
*2) 10 mm rectangular cells (quartz) and disposable cells (Figure 3) were used for the experiments. The optional cell holder accessory enables
the measurement of a sample with a small volume (minimum volume: 100µL)
Table 1. Details of the Protein Quantitation Methods
| Principle | Concentration Range | Advantages | Disadvantages | |
|---|---|---|---|---|
| UV Abs | The absorption maximum at 280 nm corresponds to the response of the tyrosine and tryptophan and is used for the analysis method. | 50 to 2000µg/mL (*BSA) | Simple method. Sample can be used after measurement. | The absorbance differs for each protein. Proteins such as collagen and gelatin that do not have absorption at 280 nm cannot be measured. Contamination by nucleic acids with absorption in the UV region obscures the measurement. |
| Biuret | Protein solutions turn purple after the polypeptide chain chelates with a copper ion. An alkaline solution of Biuret reagent including copper sulfate and Rochelle salt is added to a protein solution. Uses the absorption maximum at 540 nm to determine the quantity. | 150 to 9000µg/mL (BSA) | Simple procedure. The chromogenic rate is constant for most proteins. | Low sensitivity. Sample with a low protein concentration cannot be measured. The chromogenic reaction is influenced by high-concentrations of trisaminomethane, amino acids, and ammonium ion. |
| Lowry | Add an alkaline copper solution to a protein solution. Tyrosine, tryptophan, and cisteine of proteins reduce molybdenum acid and phosphotungstic acid of a phenol reagent, turning the solution blue. Uses the absorption maximum at 750 nm to determine the quantity. | 5 to 200ug/µL (BSA) | High sensitivity. Widely used. | Complicated procedure with a long preparation. Since the chromogenic reaction occurs by a reduction reaction, contamination of the reduction material interferes with the quantitative determination. The chromogenic rate differs for each protein. |
| BCA | The BCA method combines the Biuret method and Bicinchoninic Acid (BCA). BCA has high sensitivity and selectivity for copper ions. When a copper ion that is formed by the reduction action of protein reacts with 2 molecules of the BCA, the solution turns purple. Uses the absorption maximum at 560 nm to determine the quantity. | 20 to 2000ug/µL (BSA) | Simple procedure. High sensitivity with wide concentration range. | Thiol, phospholipid, and ammonium sulfate interferes with the measurement. |
| Bradford | The absorption maximum of a protein shifts from 465 nm to 600 nm when the protein binds to the Coomassie Brilliant Blue G250, one of triphenylmethanse blue pigment. Uses the absorption maximum at 600 nm to determine the quantity. | 10 to 2000g/µL (BSA) | Very simple operation. Hardly influenced by the blocking materials. | The chromogenic rate differs for each protein. Contamination by a surfactant can interfere with the chromogenic reaction. |
| WST | Reduce WST-8 with proteins with a high pH, turning the sample blue. Uses the absorption maximum at 650 nm to determine the quantity. | 50 to 5000µg/mL (BSA) | Simple method. Hardly affected by a surfactant. | The chromogenic rate differs for each protein. |
*BSA: Bovine Serum Albumin
1. UV Absorption Method
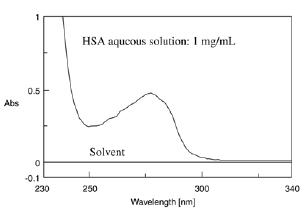
Figure 4 illustrates the absorption spectrum of Human Serum Albumin (HSA). Simple UV Absorption spectrophotometry can determine the quantity of proteins in the sample by using the maximum absorption at 280 nm.
1.1 Samples
| Bovine Serum Albumin (BSA): | 0.02, 0.025, 0.05, 0.1, 0.2, 0.25, 0.4, 0.5, 1, (1.5, 2) mg/mL |
| Hen Egg Lysozyme: | 0.02, 0.025, 0.05, 0.1, 0.2, 0.25, (0.4, 0.5) mg/mL |
| Chymotrypsin from bovine pancreas: | 0, 0.1, 0.2, 0.25, 0.4, 0.5 mg/mL |
Bracketed values are for concentrations used with a 10 mm rectangular cell. The other values are concentrations used with a 10 mm rectangular cell and micro cell.
1.2 Measurement Procedures
Measure the absorbance of the protein solution at 280 nm.
Table 2. Results for the UV Absorption Method
| Protein | Cell | Concentration Range | Calibration Curve Formula | Correlation Function | Standard Error | Detection Limit | Determination Limit |
|---|---|---|---|---|---|---|---|
| BSA | 10 mm rectangular cell (quartz) | to 2 mg/mL | Y = AX + B A = 0.6652 ±0.0079 B = -0.0130 ±0.0064 | 0.9994 | 0.0219 | 0.0097 mg/mL | 0.0470 mg/mL |
| Micro cell | to 1 mg/mL | Y = AX + B A = 0.6713 ±0.0043 B = -0.0016 ±0.0008 | 0.9999 | 0.002 | 0.0012 mg/mL | 0.0218 mg/mL | |
| HEL | 10 mm rectangular cell (quartz) | to 0.5 mg/mL | Y = AX + B A = 0.6474 ±0.0459 B = -0.0150 ±0.0109 | 0.9991 | 0.0076 | 0.0041 mg/mL | 0.0680 mg/mL |
| Micro cell | to 0.25 mg/mL | Y = AX + B A = 2.7499 ±0.0429 B = -0.0060 ±0.0055 | 0.9995 | 0.0031 | 0.0020 mg/mL | 0.0096 mg/mL | |
| α-Chymotrypsin | 10 mm rectangular cell (quartz) | to 0.5 mg/mL | Y = AX + B A = 1.904 ±0.0237 B = -0.0035±0.0070 | 0.9997 | 0.0042 | 0.0037 mg/mL | 0.0615 mg/mL |
| Micro cell | to 0.5 mg/mL | Y = AX + B A = 2.1279 ±0.0655 B = -0.0202 ±0.0193 | 0.9983 | 0.0104 | 0.0091 mg/mL | 0.1263 mg/mL |
2. Biuret Method
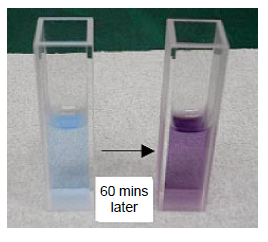
Protein solutions turn purple with an absorption maximum of 540 nm when Biuret reagent is added (Figure 5).
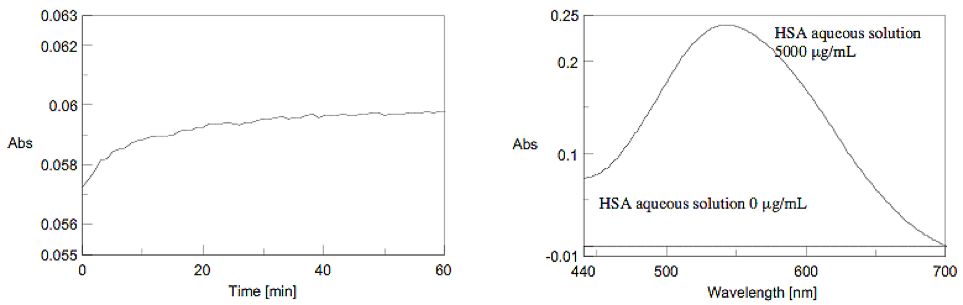
The time course of the chromogenic reaction was measured at 540 nm absorption. The absorbance became stable approximately after 60 minutes (Figure 6). Figure 7 shows the spectra of the HSA aqueous solutions that were measured after 60 minutes. The Biuret method determines the quantity by using the absorption maximum at 540 nm after reacting with the sample for 60 minutes.
2.1 Chromogenic Reagent
Biuret reagent: Add 60 mL of 10% NaOH to 100 mL of aqueous solution to dissolve 0.3 g CuSO4 and 1.2 g Rochelle salt, and then add water to make up to a total volume of 200 mL. (The standard reagent can be stored in a polyethylene bottle.)
2.2 Samples
| Bovine Serum Albumin (BSA): | 0, 0.25, 0.5, 1, 5, 9 mg/mL (10 mm rectangular cell (quartz)) |
| 0, 1, 3, 5, 9 mg/mL (Micro cell) | |
| Hen Egg Lysozyme: | 0, 1, 3, 5, 9 mg/mL (10 mm rectangular cell (quartz), Micro cell) |
| Chymotrypsin from bovine pancreas: | 0, 1, 3, 5, 9 mg/mL (10 mm rectangular cell (quartz), Micro cell) |
2.3 Measurement Procedures
Add Biuret reagent (2.0 mg) to 500 µL of protein aqueous solution and mix them well. Then react the solution for 60 minutes. Measure the absorbance at the wavelength of 540 nm.
Table 3. Results for the Biuret Method
| Protein | Cell | Concentration Range | Calibration Curve Formula | Correlation Function | Standard Error | Detection Limit | Determination Limit |
|---|---|---|---|---|---|---|---|
| BSA | 10 mm rectangular cell (quartz) | to 9 mg/mL | Y = AX2 + BX + C A = -0.0005 ± 4.3444 x 10⁻⁵ B = 0.0548 ± 0.0004 C = 0.0505 ± 0.0004 | 1 | 0.0109 | 0.008 mg/mL | 0.1483 mg/mL |
| Micro cell | to 9 mg/mL | Y = AX2 + BX + C A = -0.0016 ± 0.0003 B = 0.0653 ± 0.0027 C = 0.0450 ± 0.0045 | 0.9998 | 0.0775 | 0.0696 mg/mL | 1.0127 mg/mL | |
| Lysozyme | 10 mm rectangular cell (quartz) | to 0.9 mg/mL | Y = AX2 + BX + C A = -0.0009 ± 4.9343 x 10⁻⁵ B = 0.0591 ± 0.0005 C = 0.0509 ± 0.0008 | 1 | 0.0144 | 0.0133 mg/mL | 0.2420 mg/mL |
| Micro cell | to 9 mg/mL | Y = AX2 + BX + C A = -0.0053 ± 0.0005 B = 0.0983 ± 0.0048 C = 0.0476 ± 0.0063 | 0.9999 | 0.0786 | 0.0640 mg/mL | -- | |
| α-Chymotrypsin | 10 mm rectangular cell (quartz) | to 9 mg/mL | Y = AX2 + BX + C A = -0.0012 ± 0.0004 B = 0.0064 ± 0.0035 C = 0.0578 ± 0.0060 | 0.9996 | 0.0958 | 0.0934 mg/mL | 1.2987 mg/mL |
| Micro cell | to 9 mg/mL | Y = AX2 + BX + C A = -0.0010 ± 0.0003 B = 0.0614 ± 0.0025 C = 0.0343 ± 0.0043 | 0.9998 | 0.0697 | 0.0695 mg/mL | 0.9987 mg/mL |
3. Lowry Method
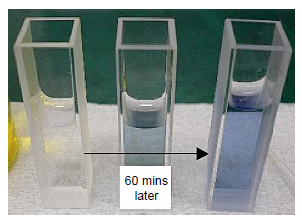
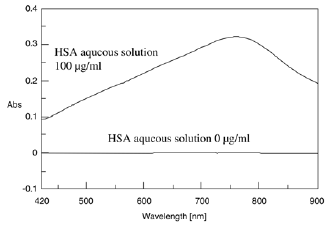
Protein solutions turn blue with an absorption maximum of 750 nm when Alkline copper solution and Phenol reagent are added to a protein solution (Figure 8).
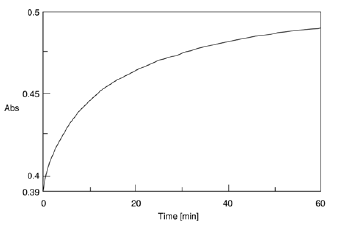
The time course of the chromogenic reaction was measured at 750 nm absorption. The absorbance became stable after approx. 60 minutes (Figure 9). Figure 10 shows the spectra of the HSA aqueous solutions that were measured after 60 minutes.
The Lowry method determines the quantity by using the absorption maximum of 750 nm after reaction of the sample for 60 minutes.
3.1 Reagents
Alkaline copper solution: Mix 50 mL of 2% Na2CO3 solution *3) with 1 mL of 0.5% CuSO4 solution*4) (can only be used for immediate analysis).
2% Na2CO3 solution: dissolve anhydrous sodium carbonate (2 g) and caustic soda (0.4 g) in 100 mL water
0.5% CuSO4 solution: dissolve copper (II) sulfate pentahydrate (50 mg) and potassium sodium tartrate tetrahydrate (0.1 g) in 10mL of water.
Phenol reagent: Dilute commercial solution (2N phenol chemical reagent of Kanto Chemical) to 1N.
3.2 Samples
Same concentrations are used both for the 10 mm rectangular cell and the micro cell of 10 mm.
| Bovine Serum Albumin (BSA): | 0, 2, 20, 50, 100, 200 µg/mL |
| Hen Egg Lysozyme: | 0, 1, 5, 10, 20, 50, 100, 200 µg/mL |
| α-Chymotrypsin from bovine pancreas: | 0, 2, 20, 50, 100, 200 µg/mL |
3.3 Measurement Procedures
Add 2.5 mg of alkaline copper solution to 500 µL of protein solution. Allow to react for 10 minutes after mixing well. Then, add phenol reagent. Rapidly mix and allow the solution to react for 60 minutes. Measure the absorbance at 750 nm.
Table 4. Results for the Lowry Method
| Protein | Cell | Concentration Range | Calibration Curve Formula | Correlation Function | Standard Error | Detection Limit | Determination Limit |
|---|---|---|---|---|---|---|---|
| BSA | 10 mm rectangular cell (quartz) | to 200 µg/mL | Y = AX2 + BX + C A = -4.4663 x 10⁻⁶± 5.5049 x 10⁻⁷ B = 0.0041 ± 0.0001 B = 0.0041 ± 0.0001 | 0.9999 | 1.2336 | 0.8385 µg/mL | 3.9441 µg/mL |
| Micro cell | to 200 µg/mL | Y = AX2 + BX + C A = -4.0578 x 10⁻⁶± 1.3689 x 10⁻⁶ B = 0.0041 ± 0.0003 C = 0.0150 ± 0.0097 | 0.9994 | 2.5325 | 2.3903 µg/mL | 10.1765 µg/mL | |
| Lysozyme | 10 mm rectangular cell (quartz) | to 200 µg/mL | Y = AX2 + BX + C A = -5.6033 x 10⁻⁶± 7.2903 x 10⁻⁷ B = 0.0049 ± 0.0001 C = 0.0293 ± 0.0037 | 0.9998 | 1.3861 | 0.7598 µg/mL | 3.5722 µg/mL |
| Micro cell | to 200 µg/mL | Y = AX2 + BX + C A = -4.8873 x 10⁻⁶± 8.2675 x 10⁻⁷ B = 0.0047 ± 0.0002 C = 0.00076 ± 0.0042 | 0.9997 | 1.6514 | 0.8911 µg/mL | 4.1471 µg/mL | |
| α-Chymotrypsin | 10 mm rectangular cell (quartz) | to 200 µg/mL | Y = AX2 + BX + C A = -1.0948 x 10⁻⁵± 4.3250 x 10⁻⁷ 0.0061 ± 8.8164 x 10⁻⁵ C = 0.0112 ± 0.0027 | 1 | 0.685 | 0.4371 µg/mL | 7.6764 µg/mL |
| Micro cell | to 200 µg/mL | Y = AX2 + BX + C A = -8.8298 x 10⁻⁶± 8.8527 x 10⁻⁷ B = 0.0614 ± 0.0025 C = 0.0343 ± 0.0043 | 0.9999 | 1.3341 | 1.0214 mg/mL | 16.3006 mg/mL |
Keywords
210-UV-0002, V-630bio, Protein concentration, protein quantitation, colorimetric assay, Bradford, BCA, Lowry, Biuret, 260/280
Featured Products:
-
A general-purpose double-beam spectrophotometer with a compact space saving design
V-730 UV-Visible Spectrophotometer
-
A high resolution UV-Visible double-beam spectrophotometer with single monochromator, variable SBW and PMT detector
V-750 UV-Visible Spectrophotometer
-
A high resolution UV-Visible double-beam, double-monochromator spectrophotometer with exceptional stray light and absorbance linearity
V-760 UV-Visible Spectrophotometer

Protein Quantitation using a UV-Visible Spectrophotometer
Introduction
UV-Visible Spectrophotometer
Generally, protein quantitation can be made using a simple UV-Visible spectrophotometer. The V-630 Bio (Figure 1) is a UV-Visible spectrophotometer designed for biochemical analysis. The V-630 Bio includes 6 quantitative methods based on UV absorption spectrophotometry including the Lowry, Biuret, BCA, Bradford, and WST methods.
Table 1 (below) shows the features of the six different quantitation methods. As outlined, a method can be selected by reviewing the sample and quantitation range and the presence of possible contaminants. Five of the analysis methods use a chromogenic reaction. Reagent manufacturers produce chromogenic kits for BCA, Bradford or WST with a protocol explaining the relevant measurement procedures *1). Chromogenic reagents for the Lowry and Biuret methods must be prepared by the user. The measurement procedures for the Lowry and Biuret methods differ according to use. For that reason, this application note explains how to create the calibration curves for the Lowry, Biuret and UV absorption analysis methods. Fluctuations in the values depending on the type of proteins and the differences in the concentration ranges calculated as a result of the cell volume *2) were also investigated.
*1) BCA method: BCA Protein Assy Kit – by PIERCE
Bradford method: Protein Quantification Kit – Rapid by DOJINDO
WST method: Protein Quantification Kit – Wide Range by DOJINDO
*2) 10 mm rectangular cells (quartz) and disposable cells (Figure 3) were used for the experiments. The optional cell holder accessory enables
the measurement of a sample with a small volume (minimum volume: 100µL)
Table 1. Details of the Protein Quantitation Methods
| Principle | Concentration Range | Advantages | Disadvantages | |
|---|---|---|---|---|
| UV Abs | The absorption maximum at 280 nm corresponds to the response of the tyrosine and tryptophan and is used for the analysis method. | 50 to 2000µg/mL (*BSA) | Simple method. Sample can be used after measurement. | The absorbance differs for each protein. Proteins such as collagen and gelatin that do not have absorption at 280 nm cannot be measured. Contamination by nucleic acids with absorption in the UV region obscures the measurement. |
| Biuret | Protein solutions turn purple after the polypeptide chain chelates with a copper ion. An alkaline solution of Biuret reagent including copper sulfate and Rochelle salt is added to a protein solution. Uses the absorption maximum at 540 nm to determine the quantity. | 150 to 9000µg/mL (BSA) | Simple procedure. The chromogenic rate is constant for most proteins. | Low sensitivity. Sample with a low protein concentration cannot be measured. The chromogenic reaction is influenced by high-concentrations of trisaminomethane, amino acids, and ammonium ion. |
| Lowry | Add an alkaline copper solution to a protein solution. Tyrosine, tryptophan, and cisteine of proteins reduce molybdenum acid and phosphotungstic acid of a phenol reagent, turning the solution blue. Uses the absorption maximum at 750 nm to determine the quantity. | 5 to 200ug/µL (BSA) | High sensitivity. Widely used. | Complicated procedure with a long preparation. Since the chromogenic reaction occurs by a reduction reaction, contamination of the reduction material interferes with the quantitative determination. The chromogenic rate differs for each protein. |
| BCA | The BCA method combines the Biuret method and Bicinchoninic Acid (BCA). BCA has high sensitivity and selectivity for copper ions. When a copper ion that is formed by the reduction action of protein reacts with 2 molecules of the BCA, the solution turns purple. Uses the absorption maximum at 560 nm to determine the quantity. | 20 to 2000ug/µL (BSA) | Simple procedure. High sensitivity with wide concentration range. | Thiol, phospholipid, and ammonium sulfate interferes with the measurement. |
| Bradford | The absorption maximum of a protein shifts from 465 nm to 600 nm when the protein binds to the Coomassie Brilliant Blue G250, one of triphenylmethanse blue pigment. Uses the absorption maximum at 600 nm to determine the quantity. | 10 to 2000g/µL (BSA) | Very simple operation. Hardly influenced by the blocking materials. | The chromogenic rate differs for each protein. Contamination by a surfactant can interfere with the chromogenic reaction. |
| WST | Reduce WST-8 with proteins with a high pH, turning the sample blue. Uses the absorption maximum at 650 nm to determine the quantity. | 50 to 5000µg/mL (BSA) | Simple method. Hardly affected by a surfactant. | The chromogenic rate differs for each protein. |
*BSA: Bovine Serum Albumin
1. UV Absorption Method
Figure 4 illustrates the absorption spectrum of Human Serum Albumin (HSA). Simple UV Absorption spectrophotometry can determine the quantity of proteins in the sample by using the maximum absorption at 280 nm.
1.1 Samples
| Bovine Serum Albumin (BSA): | 0.02, 0.025, 0.05, 0.1, 0.2, 0.25, 0.4, 0.5, 1, (1.5, 2) mg/mL |
| Hen Egg Lysozyme: | 0.02, 0.025, 0.05, 0.1, 0.2, 0.25, (0.4, 0.5) mg/mL |
| Chymotrypsin from bovine pancreas: | 0, 0.1, 0.2, 0.25, 0.4, 0.5 mg/mL |
Bracketed values are for concentrations used with a 10 mm rectangular cell. The other values are concentrations used with a 10 mm rectangular cell and micro cell.
1.2 Measurement Procedures
Measure the absorbance of the protein solution at 280 nm.
Table 2. Results for the UV Absorption Method
| Protein | Cell | Concentration Range | Calibration Curve Formula | Correlation Function | Standard Error | Detection Limit | Determination Limit |
|---|---|---|---|---|---|---|---|
| BSA | 10 mm rectangular cell (quartz) | to 2 mg/mL | Y = AX + B A = 0.6652 ±0.0079 B = -0.0130 ±0.0064 | 0.9994 | 0.0219 | 0.0097 mg/mL | 0.0470 mg/mL |
| Micro cell | to 1 mg/mL | Y = AX + B A = 0.6713 ±0.0043 B = -0.0016 ±0.0008 | 0.9999 | 0.002 | 0.0012 mg/mL | 0.0218 mg/mL | |
| HEL | 10 mm rectangular cell (quartz) | to 0.5 mg/mL | Y = AX + B A = 0.6474 ±0.0459 B = -0.0150 ±0.0109 | 0.9991 | 0.0076 | 0.0041 mg/mL | 0.0680 mg/mL |
| Micro cell | to 0.25 mg/mL | Y = AX + B A = 2.7499 ±0.0429 B = -0.0060 ±0.0055 | 0.9995 | 0.0031 | 0.0020 mg/mL | 0.0096 mg/mL | |
| α-Chymotrypsin | 10 mm rectangular cell (quartz) | to 0.5 mg/mL | Y = AX + B A = 1.904 ±0.0237 B = -0.0035±0.0070 | 0.9997 | 0.0042 | 0.0037 mg/mL | 0.0615 mg/mL |
| Micro cell | to 0.5 mg/mL | Y = AX + B A = 2.1279 ±0.0655 B = -0.0202 ±0.0193 | 0.9983 | 0.0104 | 0.0091 mg/mL | 0.1263 mg/mL |
2. Biuret Method
Protein solutions turn purple with an absorption maximum of 540 nm when Biuret reagent is added (Figure 5).
The time course of the chromogenic reaction was measured at 540 nm absorption. The absorbance became stable approximately after 60 minutes (Figure 6). Figure 7 shows the spectra of the HSA aqueous solutions that were measured after 60 minutes. The Biuret method determines the quantity by using the absorption maximum at 540 nm after reacting with the sample for 60 minutes.
2.1 Chromogenic Reagent
Biuret reagent: Add 60 mL of 10% NaOH to 100 mL of aqueous solution to dissolve 0.3 g CuSO4 and 1.2 g Rochelle salt, and then add water to make up to a total volume of 200 mL. (The standard reagent can be stored in a polyethylene bottle.)
2.2 Samples
| Bovine Serum Albumin (BSA): | 0, 0.25, 0.5, 1, 5, 9 mg/mL (10 mm rectangular cell (quartz)) |
| 0, 1, 3, 5, 9 mg/mL (Micro cell) | |
| Hen Egg Lysozyme: | 0, 1, 3, 5, 9 mg/mL (10 mm rectangular cell (quartz), Micro cell) |
| Chymotrypsin from bovine pancreas: | 0, 1, 3, 5, 9 mg/mL (10 mm rectangular cell (quartz), Micro cell) |
2.3 Measurement Procedures
Add Biuret reagent (2.0 mg) to 500 µL of protein aqueous solution and mix them well. Then react the solution for 60 minutes. Measure the absorbance at the wavelength of 540 nm.
Table 3. Results for the Biuret Method
| Protein | Cell | Concentration Range | Calibration Curve Formula | Correlation Function | Standard Error | Detection Limit | Determination Limit |
|---|---|---|---|---|---|---|---|
| BSA | 10 mm rectangular cell (quartz) | to 9 mg/mL | Y = AX2 + BX + C A = -0.0005 ± 4.3444 x 10⁻⁵ B = 0.0548 ± 0.0004 C = 0.0505 ± 0.0004 | 1 | 0.0109 | 0.008 mg/mL | 0.1483 mg/mL |
| Micro cell | to 9 mg/mL | Y = AX2 + BX + C A = -0.0016 ± 0.0003 B = 0.0653 ± 0.0027 C = 0.0450 ± 0.0045 | 0.9998 | 0.0775 | 0.0696 mg/mL | 1.0127 mg/mL | |
| Lysozyme | 10 mm rectangular cell (quartz) | to 0.9 mg/mL | Y = AX2 + BX + C A = -0.0009 ± 4.9343 x 10⁻⁵ B = 0.0591 ± 0.0005 C = 0.0509 ± 0.0008 | 1 | 0.0144 | 0.0133 mg/mL | 0.2420 mg/mL |
| Micro cell | to 9 mg/mL | Y = AX2 + BX + C A = -0.0053 ± 0.0005 B = 0.0983 ± 0.0048 C = 0.0476 ± 0.0063 | 0.9999 | 0.0786 | 0.0640 mg/mL | -- | |
| α-Chymotrypsin | 10 mm rectangular cell (quartz) | to 9 mg/mL | Y = AX2 + BX + C A = -0.0012 ± 0.0004 B = 0.0064 ± 0.0035 C = 0.0578 ± 0.0060 | 0.9996 | 0.0958 | 0.0934 mg/mL | 1.2987 mg/mL |
| Micro cell | to 9 mg/mL | Y = AX2 + BX + C A = -0.0010 ± 0.0003 B = 0.0614 ± 0.0025 C = 0.0343 ± 0.0043 | 0.9998 | 0.0697 | 0.0695 mg/mL | 0.9987 mg/mL |
3. Lowry Method
Protein solutions turn blue with an absorption maximum of 750 nm when Alkline copper solution and Phenol reagent are added to a protein solution (Figure 8).
The time course of the chromogenic reaction was measured at 750 nm absorption. The absorbance became stable after approx. 60 minutes (Figure 9). Figure 10 shows the spectra of the HSA aqueous solutions that were measured after 60 minutes.
The Lowry method determines the quantity by using the absorption maximum of 750 nm after reaction of the sample for 60 minutes.
3.1 Reagents
Alkaline copper solution: Mix 50 mL of 2% Na2CO3 solution *3) with 1 mL of 0.5% CuSO4 solution*4) (can only be used for immediate analysis).
2% Na2CO3 solution: dissolve anhydrous sodium carbonate (2 g) and caustic soda (0.4 g) in 100 mL water
0.5% CuSO4 solution: dissolve copper (II) sulfate pentahydrate (50 mg) and potassium sodium tartrate tetrahydrate (0.1 g) in 10mL of water.
Phenol reagent: Dilute commercial solution (2N phenol chemical reagent of Kanto Chemical) to 1N.
3.2 Samples
Same concentrations are used both for the 10 mm rectangular cell and the micro cell of 10 mm.
| Bovine Serum Albumin (BSA): | 0, 2, 20, 50, 100, 200 µg/mL |
| Hen Egg Lysozyme: | 0, 1, 5, 10, 20, 50, 100, 200 µg/mL |
| α-Chymotrypsin from bovine pancreas: | 0, 2, 20, 50, 100, 200 µg/mL |
3.3 Measurement Procedures
Add 2.5 mg of alkaline copper solution to 500 µL of protein solution. Allow to react for 10 minutes after mixing well. Then, add phenol reagent. Rapidly mix and allow the solution to react for 60 minutes. Measure the absorbance at 750 nm.
Table 4. Results for the Lowry Method
| Protein | Cell | Concentration Range | Calibration Curve Formula | Correlation Function | Standard Error | Detection Limit | Determination Limit |
|---|---|---|---|---|---|---|---|
| BSA | 10 mm rectangular cell (quartz) | to 200 µg/mL | Y = AX2 + BX + C A = -4.4663 x 10⁻⁶± 5.5049 x 10⁻⁷ B = 0.0041 ± 0.0001 B = 0.0041 ± 0.0001 | 0.9999 | 1.2336 | 0.8385 µg/mL | 3.9441 µg/mL |
| Micro cell | to 200 µg/mL | Y = AX2 + BX + C A = -4.0578 x 10⁻⁶± 1.3689 x 10⁻⁶ B = 0.0041 ± 0.0003 C = 0.0150 ± 0.0097 | 0.9994 | 2.5325 | 2.3903 µg/mL | 10.1765 µg/mL | |
| Lysozyme | 10 mm rectangular cell (quartz) | to 200 µg/mL | Y = AX2 + BX + C A = -5.6033 x 10⁻⁶± 7.2903 x 10⁻⁷ B = 0.0049 ± 0.0001 C = 0.0293 ± 0.0037 | 0.9998 | 1.3861 | 0.7598 µg/mL | 3.5722 µg/mL |
| Micro cell | to 200 µg/mL | Y = AX2 + BX + C A = -4.8873 x 10⁻⁶± 8.2675 x 10⁻⁷ B = 0.0047 ± 0.0002 C = 0.00076 ± 0.0042 | 0.9997 | 1.6514 | 0.8911 µg/mL | 4.1471 µg/mL | |
| α-Chymotrypsin | 10 mm rectangular cell (quartz) | to 200 µg/mL | Y = AX2 + BX + C A = -1.0948 x 10⁻⁵± 4.3250 x 10⁻⁷ 0.0061 ± 8.8164 x 10⁻⁵ C = 0.0112 ± 0.0027 | 1 | 0.685 | 0.4371 µg/mL | 7.6764 µg/mL |
| Micro cell | to 200 µg/mL | Y = AX2 + BX + C A = -8.8298 x 10⁻⁶± 8.8527 x 10⁻⁷ B = 0.0614 ± 0.0025 C = 0.0343 ± 0.0043 | 0.9999 | 1.3341 | 1.0214 mg/mL | 16.3006 mg/mL |
Keywords
210-UV-0002, V-630bio, Protein concentration, protein quantitation, colorimetric assay, Bradford, BCA, Lowry, Biuret, 260/280