Secondary Structure Analysis (SSE) Software for Infrared Interpretation and Modeling of Proteins
August 25, 2022
 Download This Application
Introduction

As the last strands of the human genome project unravel, the focus now turns to proteomics. There are several instrumental methods to analyze protein chemistry and there is particular interest in the functional activity that can be directly attributed to the physical arrangement of a protein.
As opposed to simple chemicals, the 3-dimensional structure of proteins is an inherent part of the protein reactivity and functionality. For instance, muscle fiber is composed primarily of a single type of protein (fibrinogen) with a specific physical structure. In other proteins, rearrangement of the physical configuration can enhance or restrict the protein functionality or reactivity. Thus, the physical arrangement of the protein is as important as the sequence of amino acids. NMR analysis requires very expensive instrumentation. By contrast, FTIR analysis is readily available in most laboratories, has few constraints on sample type or methodology, is inexpensive and simple to operate. As a result, the study and interpretation of infrared protein spectra have been well documented in the literature1-5.
Although there are numerous vibrational interactions possible for crystalline proteins, in truth, most of them present infrared spectra much like synthetic polymers (Figure 1). Demonstrating C-H stretching and bending and some skeletal bands, protein spectra are quite simple in comparison to the complexity often presented by individual chemical spectra. Because of the role played by the amide groups as the backbone for the amino acid residues, the amide vibrational data provides the critical information necessary to predict the secondary structure of the protein. But the variations in the amide band structures are subtle and can be difficult to interpret.
Table 1. Protein Structural Relationships
| Protein Structure | Structure Determined by | Methods of Analysis |
|---|---|---|
| Primary | The amino acid sequence (Ala, Gly, Ile, Tyr) | amino acid cleavage, DNA analysis |
| Secondary | Local, 'steric' structure, shape of peptide chains (α-helix, β-sheet, β-turn, etc.) | XRD, CD, FT-IR, NMR, Computer simulation |
| Tertiary | Actual 3-dimensional structure (hydrogen bonding, van-der-Waals forces, weak ring interactions, salt bridges, etc.) | XRD, NMR, computer simulation |
| Quaternary | Interaction between polypeptide units | NMR, computer simulation |
The amino acids ‘polymerize’ when a protein is formed, bonding the carbonyl group of one amino acid to the nitrogen of the amine in another while losing a molecule of water. The same common backbone, NH2-CHR-COOH, is present in all amino acids with R as one of the possible amino acid residues. The protein ‘polypeptide’, is a repeating sequence of the amino acid residues. The various functional groups of the amino acids and the sequence defines the protein and specificity. However, the interaction of the various amino acid groups amongst themselves also determines protein functionality with a direct influence on the protein’s physical structure.
Proteins are so structurally complex, the 3-dimensional configuration can only be described using four ‘structures’ (Table 1), defined as primary, secondary, tertiary and quaternary structure.
Primary structure is simply the amino acid sequence, defined by the DNA template. Secondary structure is the physical arrangement of the peptide chains as they fold and bend around the various molecular and steric constraints of the amino acid residues. Tertiary and quaternary structures define the 3D arrangement of the peptide chains and are determined by the various ‘weak’ forces and the interaction of the polypeptide units themselves.
The secondary structure is of intense interest because the configuration determines the reactivity of the protein and can change under certain conditions. There are several methods of analysis used to determine secondary structure (Table 1), but XRD and CD analysis have limited application due to sampling requirements and The JASCO Secondary Structure Estimation (SSE) software uses a spectral modeling procedure for multivariate analysis of infrared protein spectra predicting the secondary structure based on a spectral database of analyzed proteins. Whether the protein is composed of one type of secondary structure, e.g., α-helix, β-sheet, etc. or multiple structural elements, the SSE software can provide an answer.

Table 2. Predicted SSE for Protein Solutions
| Predicted Fit | α-helix | β-sheet | β-turn | Other |
|---|---|---|---|---|
| Hemoglobin | 85% | 0% | 7% | 5% |
| Lysozyme | 36% | 9% | 36% | 24% |
Experimental
All spectra were collected using an FT/IR-4600 instrument system equipped with the Spectra Manager II software suite and the optional Secondary Structure Estimation (SSE) software program. Protein spectra were collected using 64 scans at 4 cm-1 resolution, co-added and averaged to obtain all single-beam background and sample spectra. Sample spectra were analyzed with the SSE software after data collection.
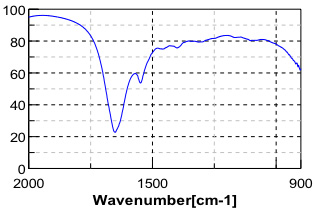
Myoglobin and lysozyme samples were dissolved into buffer solution then analyzed as a thin film between two ZnSe windows in a liquid demountable cell. The fingerprint region of a spectrum of lysozome solution is presented as Figure 2.
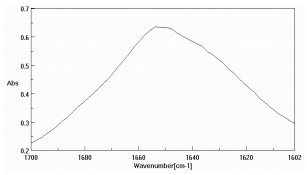
Figure 3 is the amide region of the lysozyme solution prior to data pre-treatment while Figure 4 is after the buffer subtraction and water vapor correction. Figure 4 also illustrates the various protein secondary structure models as they are used to fit the lysozyme data (black trace). The SSE prediction results for both protein solutions are presented as Table 2, agreeing with published data3,5.
While simple, these examples illustrate the ease with which the analysis is conducted. Simply collect the infrared spectra of the protein solution and the buffer, supply the spectra to the SSE software and the secondary structure prediction is calculated within seconds.
In addition, the accuracy of the SSE program increases as corroborated protein spectra are added to your personal database. Supplied with an initial database of over 50 proteins and their substantiated secondary structure, the SSE software package is ready and able to provide answers from the very start of data processing.
Conclusion
The SSE program may not be able to provide a complete confirmation of the various protein structures but it is an extremely powerful tool for the rapid determination of protein secondary structure.
- Miyazawa, T. J. Chem. Phys., 32, 1657, 1960.
- Miyazawa, T., and Blout, E. R., J. Amer. Chem. Soc., 83, 712, 1961.
- Krimm, S. and Bandekar, J., Advances in Protein Chemistry, 38, 181, 1986.
- “Spectroscopic Methods for Determining Protein Structure in Solution”, H. A. Havel, ed., VCH Weinheim, Germany, 1996.
- “Infrared Spectroscopy of Biomolecules”, H. H. Mantsch and D. Chapman, eds. Wiley-Liss, New York, NY, 1996.
Featured Products:
-

Compact fixed range mid-IR spectrometer with options to extend to the NIR/FIR
FT/IR-4X

Secondary Structure Analysis (SSE) Software for Infrared Interpretation and Modeling of Proteins
Introduction
As the last strands of the human genome project unravel, the focus now turns to proteomics. There are several instrumental methods to analyze protein chemistry and there is particular interest in the functional activity that can be directly attributed to the physical arrangement of a protein.
As opposed to simple chemicals, the 3-dimensional structure of proteins is an inherent part of the protein reactivity and functionality. For instance, muscle fiber is composed primarily of a single type of protein (fibrinogen) with a specific physical structure. In other proteins, rearrangement of the physical configuration can enhance or restrict the protein functionality or reactivity. Thus, the physical arrangement of the protein is as important as the sequence of amino acids. NMR analysis requires very expensive instrumentation. By contrast, FTIR analysis is readily available in most laboratories, has few constraints on sample type or methodology, is inexpensive and simple to operate. As a result, the study and interpretation of infrared protein spectra have been well documented in the literature1-5.
Although there are numerous vibrational interactions possible for crystalline proteins, in truth, most of them present infrared spectra much like synthetic polymers (Figure 1). Demonstrating C-H stretching and bending and some skeletal bands, protein spectra are quite simple in comparison to the complexity often presented by individual chemical spectra. Because of the role played by the amide groups as the backbone for the amino acid residues, the amide vibrational data provides the critical information necessary to predict the secondary structure of the protein. But the variations in the amide band structures are subtle and can be difficult to interpret.
Table 1. Protein Structural Relationships
| Protein Structure | Structure Determined by | Methods of Analysis |
|---|---|---|
| Primary | The amino acid sequence (Ala, Gly, Ile, Tyr) | amino acid cleavage, DNA analysis |
| Secondary | Local, 'steric' structure, shape of peptide chains (α-helix, β-sheet, β-turn, etc.) | XRD, CD, FT-IR, NMR, Computer simulation |
| Tertiary | Actual 3-dimensional structure (hydrogen bonding, van-der-Waals forces, weak ring interactions, salt bridges, etc.) | XRD, NMR, computer simulation |
| Quaternary | Interaction between polypeptide units | NMR, computer simulation |
The amino acids ‘polymerize’ when a protein is formed, bonding the carbonyl group of one amino acid to the nitrogen of the amine in another while losing a molecule of water. The same common backbone, NH2-CHR-COOH, is present in all amino acids with R as one of the possible amino acid residues. The protein ‘polypeptide’, is a repeating sequence of the amino acid residues. The various functional groups of the amino acids and the sequence defines the protein and specificity. However, the interaction of the various amino acid groups amongst themselves also determines protein functionality with a direct influence on the protein’s physical structure.
Proteins are so structurally complex, the 3-dimensional configuration can only be described using four ‘structures’ (Table 1), defined as primary, secondary, tertiary and quaternary structure.
Primary structure is simply the amino acid sequence, defined by the DNA template. Secondary structure is the physical arrangement of the peptide chains as they fold and bend around the various molecular and steric constraints of the amino acid residues. Tertiary and quaternary structures define the 3D arrangement of the peptide chains and are determined by the various ‘weak’ forces and the interaction of the polypeptide units themselves.
The secondary structure is of intense interest because the configuration determines the reactivity of the protein and can change under certain conditions. There are several methods of analysis used to determine secondary structure (Table 1), but XRD and CD analysis have limited application due to sampling requirements and The JASCO Secondary Structure Estimation (SSE) software uses a spectral modeling procedure for multivariate analysis of infrared protein spectra predicting the secondary structure based on a spectral database of analyzed proteins. Whether the protein is composed of one type of secondary structure, e.g., α-helix, β-sheet, etc. or multiple structural elements, the SSE software can provide an answer.
Table 2. Predicted SSE for Protein Solutions
| Predicted Fit | α-helix | β-sheet | β-turn | Other |
|---|---|---|---|---|
| Hemoglobin | 85% | 0% | 7% | 5% |
| Lysozyme | 36% | 9% | 36% | 24% |
Experimental
All spectra were collected using an FT/IR-4600 instrument system equipped with the Spectra Manager II software suite and the optional Secondary Structure Estimation (SSE) software program. Protein spectra were collected using 64 scans at 4 cm-1 resolution, co-added and averaged to obtain all single-beam background and sample spectra. Sample spectra were analyzed with the SSE software after data collection.
Myoglobin and lysozyme samples were dissolved into buffer solution then analyzed as a thin film between two ZnSe windows in a liquid demountable cell. The fingerprint region of a spectrum of lysozome solution is presented as Figure 2.
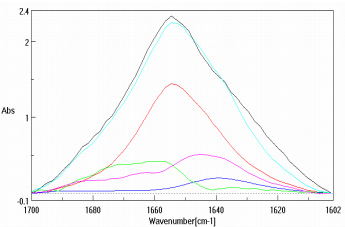
Figure 3 is the amide region of the lysozyme solution prior to data pre-treatment while Figure 4 is after the buffer subtraction and water vapor correction. Figure 4 also illustrates the various protein secondary structure models as they are used to fit the lysozyme data (black trace). The SSE prediction results for both protein solutions are presented as Table 2, agreeing with published data3,5.
While simple, these examples illustrate the ease with which the analysis is conducted. Simply collect the infrared spectra of the protein solution and the buffer, supply the spectra to the SSE software and the secondary structure prediction is calculated within seconds.
In addition, the accuracy of the SSE program increases as corroborated protein spectra are added to your personal database. Supplied with an initial database of over 50 proteins and their substantiated secondary structure, the SSE software package is ready and able to provide answers from the very start of data processing.
Conclusion
The SSE program may not be able to provide a complete confirmation of the various protein structures but it is an extremely powerful tool for the rapid determination of protein secondary structure.
- Miyazawa, T. J. Chem. Phys., 32, 1657, 1960.
- Miyazawa, T., and Blout, E. R., J. Amer. Chem. Soc., 83, 712, 1961.
- Krimm, S. and Bandekar, J., Advances in Protein Chemistry, 38, 181, 1986.
- “Spectroscopic Methods for Determining Protein Structure in Solution”, H. A. Havel, ed., VCH Weinheim, Germany, 1996.
- “Infrared Spectroscopy of Biomolecules”, H. H. Mantsch and D. Chapman, eds. Wiley-Liss, New York, NY, 1996.