Quantitative Analysis of Trans-Fats in Food Products using an FTIR-ATR Method
June 13, 2024
 Download This Application
Introduction
Trans-fats are formed when liquid oils are modified into solids. These trans fats are used in a variety of food products. The excessive consumption of trans-fats increases LDL (bad) cholesterol in the blood and decreases HDL (good) cholesterol. Consequently, the consumption of trans-fat products can increase the incidence of ischemic cardiac disease and thus, the trans-fat content in food is of great concern. According to reports by a joint specialists conference of the Food and Agriculture Organization (FAO) and the World Health Organization (WHO) of the United Nations, it is proposed that the intake of trans-fats should be less than 1% of the overall caloric intake. As a result of these findings, many foreign countries are mandating the disclosure of trans-fat content in foods; some EU countries control the content in food and some other countries such as U.S., Canada and Korea are obligated to include the trans-fat content on all food labeling. In Japan, the Consumer Affairs Agency recently announced that food producers will be obligated to state the trans-fats content of food products.
For these reasons, it is becoming more important to quantify the trans-fats content in food. A quantitative analysis is generally performed according to official methods proscribed by regulatory bodies, with gas chromatography (GC) or infrared spectroscopy being currently used for the official methods for the measurement of trans-fats. The GC method widely used requires some complicated procedures such as separation extraction of the sample and esterification, and thus requires considerable time and cost. The American Organization of Analytical Chemists (AOAC) formulated a method AOAC 2000.10 using infrared spectroscopy with ATR to evaluate the trans-fat content.
In this application, we demonstrated the quantitative analysis of trans-fats in several types of oil with a calibration made according to the official AOAC ATR method.
Experimental
The AOAC 2000.10 method requires a quantitative calibration be developed and the quantitative analysis of unknown samples performed by measuring the samples with an ATR crystal heated to 65°C to melt the oils completely.
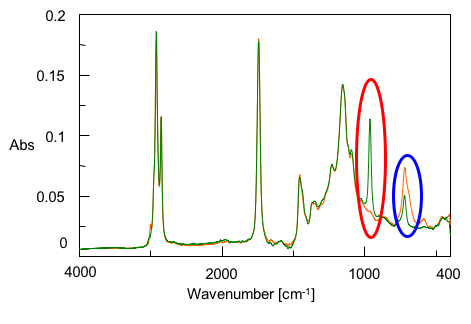
The cis- and trans-fats contained in natural fats have IR peaks in the range from 1000 cm-1 to 600 cm-1, which is used for the quantitative analysis (Figure 1). In the official method, cis-triolein and trans-trielaidin are used as standard samples. The spectrum of cis-triolein in orange and the spectrum of trans-trielaidin in green are overlaid as displayed in Figure 1. Both spectra have similar absorptions in the mid-infrared spectral range except for specific peaks associated with the two different forms as displayed from 1000 cm-1 to 600 cm-1.
| Measurement Conditions | |||
| Instrument | FT/IR-6100 and a thermostatted single reflection ATR accessory | ||
| Detector | DLaTGS | Resolution | 4 cm-1 |
| Integration Time | 64 scans | Apodization | Triangle |
| Temperature | 65 +/- 2°C | ||
| Method | ATR method (Crystal: Diamond) Triolein and Trielaidin (Combination ratio of trielaidin: 0.5, 1, 5, 10, 20, 30, 40, 50%) |
||
| Standard Samples | Shown in Table 1 (Sample volume: 50 µL or less) |
||
Keywords
050-AT-0215B, trans fatty acids, trans fats, FTIR, transmission, ATR, LDL, HDL, cholesterol
Results
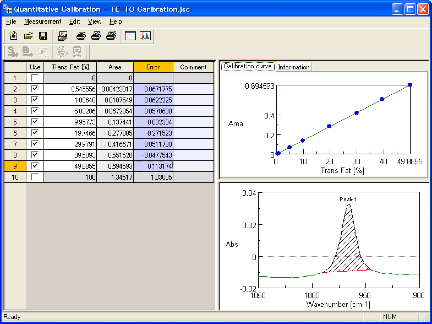
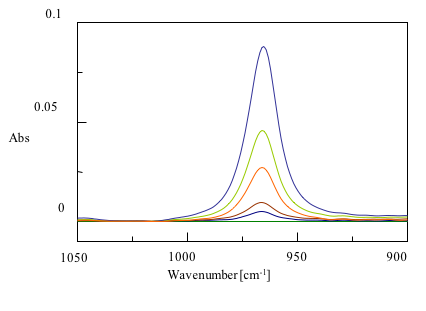
The trans-fat has a vibrational absorption peak due to the C-H bending mode near 966 cm-1 and the peak area is used for quantitation in the official method. The overlaid spectra for each concentration at 966 cm-1 are shown in Figure 2. Figure 3 is a screen shot of the Quantitative Calibration Program. The calibration curve calculated with the program is displayed in Figure 4. Table 1 outlines the result of the quantitative analysis of several commercial food oils. In general, margarine has a trans-fat content of 1 to 10%, whilst olive oil and sesame oil contain almost no trans-fat. This shows that the system as outlined is effective for the quantitative analysis of trans-fats.
By using the ATR methods, the quantity of trans-fats in various types of food oils can be determined simply and quickly without complicated procedures.

| Sample | Content Rate of Trans-Fat (%) |
| Margarine | 3.1 |
| Cooking Oil | 1.9 |
| Sesame Oil | 0.7 |
| Olive Oil | 0.8 |
| Chili Oil | 1.2 |
Featured Products:
-
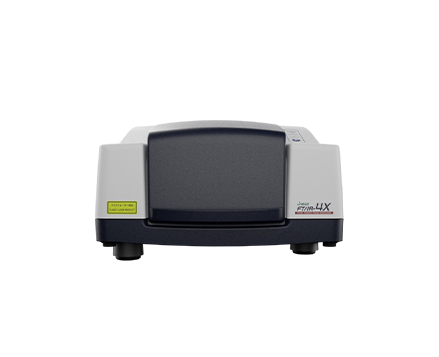
Compact fixed range mid-IR spectrometer with options to extend to the NIR/FIR
FT/IR-4X
-
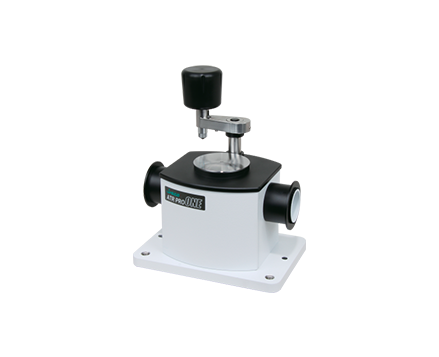
ATR PRO ONE

Quantitative Analysis of Trans-Fats in Food Products using an FTIR-ATR Method
Introduction
Trans-fats are formed when liquid oils are modified into solids. These trans fats are used in a variety of food products. The excessive consumption of trans-fats increases LDL (bad) cholesterol in the blood and decreases HDL (good) cholesterol. Consequently, the consumption of trans-fat products can increase the incidence of ischemic cardiac disease and thus, the trans-fat content in food is of great concern. According to reports by a joint specialists conference of the Food and Agriculture Organization (FAO) and the World Health Organization (WHO) of the United Nations, it is proposed that the intake of trans-fats should be less than 1% of the overall caloric intake. As a result of these findings, many foreign countries are mandating the disclosure of trans-fat content in foods; some EU countries control the content in food and some other countries such as U.S., Canada and Korea are obligated to include the trans-fat content on all food labeling. In Japan, the Consumer Affairs Agency recently announced that food producers will be obligated to state the trans-fats content of food products.
For these reasons, it is becoming more important to quantify the trans-fats content in food. A quantitative analysis is generally performed according to official methods proscribed by regulatory bodies, with gas chromatography (GC) or infrared spectroscopy being currently used for the official methods for the measurement of trans-fats. The GC method widely used requires some complicated procedures such as separation extraction of the sample and esterification, and thus requires considerable time and cost. The American Organization of Analytical Chemists (AOAC) formulated a method AOAC 2000.10 using infrared spectroscopy with ATR to evaluate the trans-fat content.
In this application, we demonstrated the quantitative analysis of trans-fats in several types of oil with a calibration made according to the official AOAC ATR method.
Experimental
The AOAC 2000.10 method requires a quantitative calibration be developed and the quantitative analysis of unknown samples performed by measuring the samples with an ATR crystal heated to 65°C to melt the oils completely.
The cis- and trans-fats contained in natural fats have IR peaks in the range from 1000 cm-1 to 600 cm-1, which is used for the quantitative analysis (Figure 1). In the official method, cis-triolein and trans-trielaidin are used as standard samples. The spectrum of cis-triolein in orange and the spectrum of trans-trielaidin in green are overlaid as displayed in Figure 1. Both spectra have similar absorptions in the mid-infrared spectral range except for specific peaks associated with the two different forms as displayed from 1000 cm-1 to 600 cm-1.
| Measurement Conditions | |||
| Instrument | FT/IR-6100 and a thermostatted single reflection ATR accessory | ||
| Detector | DLaTGS | Resolution | 4 cm-1 |
| Integration Time | 64 scans | Apodization | Triangle |
| Temperature | 65 +/- 2°C | ||
| Method | ATR method (Crystal: Diamond) Triolein and Trielaidin (Combination ratio of trielaidin: 0.5, 1, 5, 10, 20, 30, 40, 50%) |
||
| Standard Samples | Shown in Table 1 (Sample volume: 50 µL or less) |
||
Keywords
050-AT-0215B, trans fatty acids, trans fats, FTIR, transmission, ATR, LDL, HDL, cholesterol
Results
The trans-fat has a vibrational absorption peak due to the C-H bending mode near 966 cm-1 and the peak area is used for quantitation in the official method. The overlaid spectra for each concentration at 966 cm-1 are shown in Figure 2. Figure 3 is a screen shot of the Quantitative Calibration Program. The calibration curve calculated with the program is displayed in Figure 4. Table 1 outlines the result of the quantitative analysis of several commercial food oils. In general, margarine has a trans-fat content of 1 to 10%, whilst olive oil and sesame oil contain almost no trans-fat. This shows that the system as outlined is effective for the quantitative analysis of trans-fats.
By using the ATR methods, the quantity of trans-fats in various types of food oils can be determined simply and quickly without complicated procedures.
| Sample | Content Rate of Trans-Fat (%) |
| Margarine | 3.1 |
| Cooking Oil | 1.9 |
| Sesame Oil | 0.7 |
| Olive Oil | 0.8 |
| Chili Oil | 1.2 |