Retention Time and Peak Area Reproducibility in a UHPLC System (X-LC)
August 25, 2022
 Download This Application
Introduction
With recent advances in technology and the use of ultra high pressure chromatography systems becoming more commonplace, it is of use to compare reproducibility of retention time and peak area of UHPLC vs HPLC.
Experimental
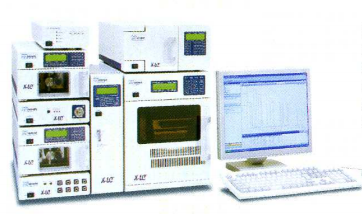
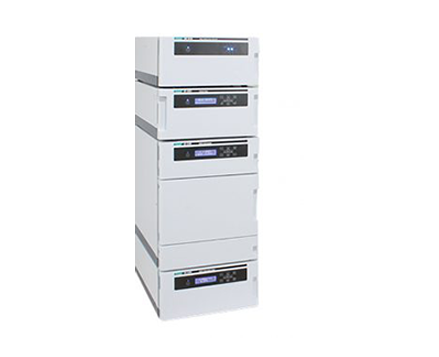
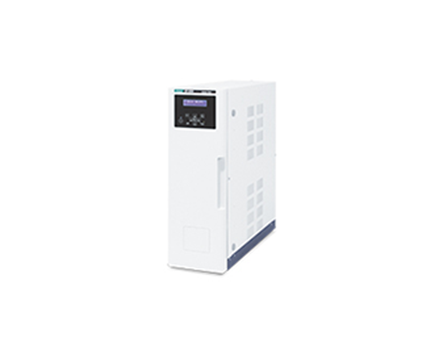
The system used in this experiment was a X-LC system comprising a 3185PU pump (up to 15,000 psi), 3080DG degasser, 3067CO column, 3070UV UV-visible detector, 3159AS autosampler (fast cycle times and low carryover), column X-PressPak C18S (2.1 mm 50 mm), 2 micron particle size
A standard mixture containing acetaminophen, caffeine, aspirin, and benzoic acid.
Results
The chromatogram in Figure 1 is a series of 15 injections overlaid. Excellent reproducibility is obtained on the X-LC system as well as a shortened analysis time of just one minute.
Table I lists the retention time and peak area Relative Standard Deviation (RSD) of the retention times. The RSD is in a range between 0.09-0.26% and that of peak area in a range between 0.38-0.86%. These results demonstrate that UHPLC and the use of X-LC hardware as being extremely reproducible and reliable, and with confidence one can replace any HPLC analysis with this technique.
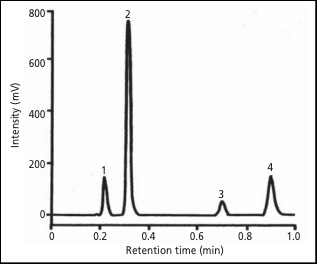
Peaks: 1. acetaminophen (0.1 mg/mL), 2. caffeine (0.1 mg/mL), 3. aspirin (0.1 mg/mL), 4. benzoic acid (6.0 mg/mL)
Conditions: column X-Presspak C18S (2.1 mm I.D. 50 mm L., 2 um), mobile phase H2O/CH3CN/CH3COOH (75/25/3), column temperature 45°C, flow rate 0.6 mL/min, detection wavelength 275 nm, injection volume 1 µL
| Reproducibility at hold time | Reproducibility in peak area | |||||
|---|---|---|---|---|---|---|
| Average (min) | Standard deviation (min) | Relative standard deviation (%) | Average (µV*sec) | Standard deviation (µV*sec) | Relative standard deviation (%) | |
| Acetaminophen | 0.214 | 0.00055 | 0.2570 | 310973 | 1239 | 0.3985 |
| Caffeine | 0.308 | 0.00070 | 0.2273 | 2E + 06 | 9656 | 0.5322 |
| Aspirin | 0.698 | 0.00075 | 0.1074 | 188500 | 1615 | 0.8568 |
| I.S. | 0.895 | 0.00080 | 0.0089 | 536004 | 2005 | 0.3740 |
Featured Products:

Retention Time and Peak Area Reproducibility in a UHPLC System (X-LC)
Introduction
With recent advances in technology and the use of ultra high pressure chromatography systems becoming more commonplace, it is of use to compare reproducibility of retention time and peak area of UHPLC vs HPLC.
Experimental
The system used in this experiment was a X-LC system comprising a 3185PU pump (up to 15,000 psi), 3080DG degasser, 3067CO column, 3070UV UV-visible detector, 3159AS autosampler (fast cycle times and low carryover), column X-PressPak C18S (2.1 mm 50 mm), 2 micron particle size
A standard mixture containing acetaminophen, caffeine, aspirin, and benzoic acid.
Results
The chromatogram in Figure 1 is a series of 15 injections overlaid. Excellent reproducibility is obtained on the X-LC system as well as a shortened analysis time of just one minute.
Table I lists the retention time and peak area Relative Standard Deviation (RSD) of the retention times. The RSD is in a range between 0.09-0.26% and that of peak area in a range between 0.38-0.86%. These results demonstrate that UHPLC and the use of X-LC hardware as being extremely reproducible and reliable, and with confidence one can replace any HPLC analysis with this technique.
Peaks: 1. acetaminophen (0.1 mg/mL), 2. caffeine (0.1 mg/mL), 3. aspirin (0.1 mg/mL), 4. benzoic acid (6.0 mg/mL)
Conditions: column X-Presspak C18S (2.1 mm I.D. 50 mm L., 2 um), mobile phase H2O/CH3CN/CH3COOH (75/25/3), column temperature 45°C, flow rate 0.6 mL/min, detection wavelength 275 nm, injection volume 1 µL
| Reproducibility at hold time | Reproducibility in peak area | |||||
|---|---|---|---|---|---|---|
| Average (min) | Standard deviation (min) | Relative standard deviation (%) | Average (µV*sec) | Standard deviation (µV*sec) | Relative standard deviation (%) | |
| Acetaminophen | 0.214 | 0.00055 | 0.2570 | 310973 | 1239 | 0.3985 |
| Caffeine | 0.308 | 0.00070 | 0.2273 | 2E + 06 | 9656 | 0.5322 |
| Aspirin | 0.698 | 0.00075 | 0.1074 | 188500 | 1615 | 0.8568 |
| I.S. | 0.895 | 0.00080 | 0.0089 | 536004 | 2005 | 0.3740 |