Secondary Structure Analysis of Poly-L-Glutamic Sodium Titration with Dilute Sulfuric Acid
January 5, 2024
 Download This Application
Introduction
Since the function of a protein is closely related to its structure, the structural analysis of proteins and peptides is becoming increasingly important to assist in deciphering bioactivity. NMR and X-ray structure analysis are two effective methods to identify protein structure, however, a large amount of sample and a lengthy acquisition time is required for both. On the other hand, CD measurements are easy to obtain, and small sample volumes can be used. Additionally, conformational changes of proteins and peptides due to pH, temperature and external ligands can also be obtained.
Once CD measurements are obtained, the abundance ratio of secondary structure can be calculated by a least squares method that uses a reference spectrum of α-helix, β-sheet, turn and random structure. The JWSSE-513 protein secondary structural analysis program uses the Classical Least Squares (CLS) method, which includes the reference spectra of Yang¹ and Reed². Yang’s reference spectra are extracted from the CD spectra of protein and are best suited for protein secondary structure analysis1,3 while Reed’s reference spectra are extracted from CD measurements of peptides and are suitable for the secondary structure analysis of peptides. Reed’s reference spectra have less of an influence from the aromatic amino acid side chain residues which are typically seen in protein spectra.
This application note demonstrates the use of the JWSSE-513 program in order to determine the secondary structure changes of poly-L-glutamic sodium titrated with dilute sulfuric acid.
Experimental
| Measurement conditions | |
|---|---|
| Data acquisition interval | 2 sec |
| Spectral bandwidth | 1 nm |
| Accumulations | 2 times |
| Data pitch | 0.1 nm |
| Scan speed | 100 nm/min |
| Path length | 10 mm |
2 mL of a 0.02 mg/mL poly-L-glutamic sodium solution is titrated with 10-5 N sulfuric acid. The titration is carried out 20 times for 50 µL aliquots using the ATS-530 automatic titration unit.
Keywords
200-CD-0004, J-1500, Circular Dichroism, CD, pharmaceuticals, biochemistry, JWSSE-513, secondary structure analysis program, ATS-429 automatic titration unit
Results
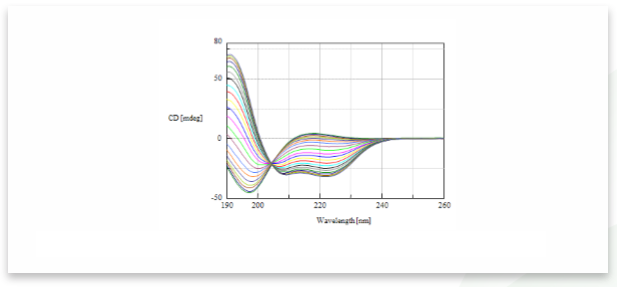
The CD spectra of poly-L-glutamic sodium solution titrated with sulfuric acid is shown in Figure 1. The figure indicates that as dilute sulfuric acid is added to the peptide sample, the CD spectrum changes from a random structure conformation to an α-helical conformation.
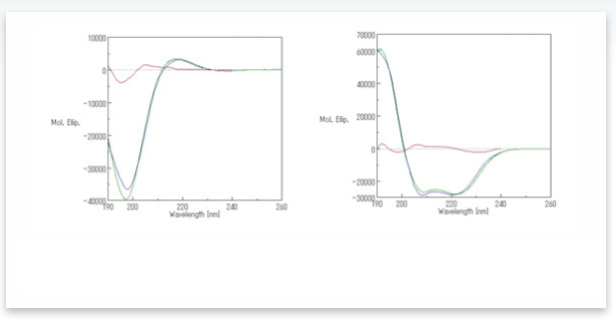
A comparison of the experimental and calculated CD spectra of poly-L-glutamic sodium solution before and after adding sulfuric acid is shown in Figure 2 and utilizes Reed’s reference spectra set. These plots illustrate that the residual error between the experimentally determined and calculated spectra is small.
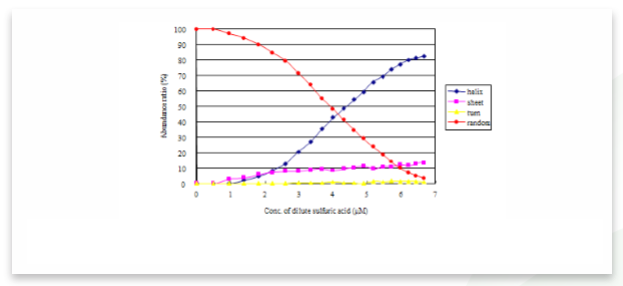
The ratio of secondary structures of the measured and calculated data also can be calculated and is shown in Figure 3. As the peptide solution becomes more acidic due to the addition of sulfuric acid, the α-helical structure ratio increases and 82.4% of poly-L-glutamic acid transitions to an α-helical structure. Under 6.6 µM sulfuric acid conditions, the random structure ratio decreases to 3.2%.
Conclusion
This application note demonstrates that the JWSSE-513 program, which utilizes Reed’s reference CD set for peptides, provides good results that can describe changes in secondary structure due to pH changes in a peptide’s environment.
Featured Products:
-
The basic, compact model for research, QA/QC, and teaching applications.
J-1100
-
Automated high-throughput screening system for use with the J-1500/1700.
High-Throughput CD
-
Highest performance with a wide range of accessories for maximum flexibility to meet complex research demands.
J-1500

Secondary Structure Analysis of Poly-L-Glutamic Sodium Titration with Dilute Sulfuric Acid
Introduction
Since the function of a protein is closely related to its structure, the structural analysis of proteins and peptides is becoming increasingly important to assist in deciphering bioactivity. NMR and X-ray structure analysis are two effective methods to identify protein structure, however, a large amount of sample and a lengthy acquisition time is required for both. On the other hand, CD measurements are easy to obtain, and small sample volumes can be used. Additionally, conformational changes of proteins and peptides due to pH, temperature and external ligands can also be obtained.
Once CD measurements are obtained, the abundance ratio of secondary structure can be calculated by a least squares method that uses a reference spectrum of α-helix, β-sheet, turn and random structure. The JWSSE-513 protein secondary structural analysis program uses the Classical Least Squares (CLS) method, which includes the reference spectra of Yang¹ and Reed². Yang’s reference spectra are extracted from the CD spectra of protein and are best suited for protein secondary structure analysis1,3 while Reed’s reference spectra are extracted from CD measurements of peptides and are suitable for the secondary structure analysis of peptides. Reed’s reference spectra have less of an influence from the aromatic amino acid side chain residues which are typically seen in protein spectra.
This application note demonstrates the use of the JWSSE-513 program in order to determine the secondary structure changes of poly-L-glutamic sodium titrated with dilute sulfuric acid.
Experimental
| Measurement conditions | |
|---|---|
| Data acquisition interval | 2 sec |
| Spectral bandwidth | 1 nm |
| Accumulations | 2 times |
| Data pitch | 0.1 nm |
| Scan speed | 100 nm/min |
| Path length | 10 mm |
2 mL of a 0.02 mg/mL poly-L-glutamic sodium solution is titrated with 10-5 N sulfuric acid. The titration is carried out 20 times for 50 µL aliquots using the ATS-530 automatic titration unit.
Results
The CD spectra of poly-L-glutamic sodium solution titrated with sulfuric acid is shown in Figure 1. The figure indicates that as dilute sulfuric acid is added to the peptide sample, the CD spectrum changes from a random structure conformation to an α-helical conformation.
A comparison of the experimental and calculated CD spectra of poly-L-glutamic sodium solution before and after adding sulfuric acid is shown in Figure 2 and utilizes Reed’s reference spectra set. These plots illustrate that the residual error between the experimentally determined and calculated spectra is small.
The ratio of secondary structures of the measured and calculated data also can be calculated and is shown in Figure 3. As the peptide solution becomes more acidic due to the addition of sulfuric acid, the α-helical structure ratio increases and 82.4% of poly-L-glutamic acid transitions to an α-helical structure. Under 6.6 µM sulfuric acid conditions, the random structure ratio decreases to 3.2%.
Conclusion
This application note demonstrates that the JWSSE-513 program, which utilizes Reed’s reference CD set for peptides, provides good results that can describe changes in secondary structure due to pH changes in a peptide’s environment.
Keywords
200-CD-0004, J-1500, Circular Dichroism, CD, pharmaceuticals, biochemistry, JWSSE-513, secondary structure analysis program, ATS-429 automatic titration unit