Speed Separation of ATP and its Degradation Products By X-LC
January 5, 2024
 Download This Application
Introduction
ATP (adenosine triphosphate) in fish meat decomposes in a following process:
ATP -> ADP (adenosine diphosphate) -> AMP (adenosine monophosphate) -> Inosinic acid -> Inosine -> Hypoxanthine
A parameter “K value” indicates freshness of fish meat and is defined as:
K value(%) = [(Inosine + Hypoxanthine) / (ATP + ADP + AMP + Inosine + Hypoxanthine)] x 100
When K value is below 20 %, fish meat can be used for Sashimi (raw use) and 20% through 60% for cooked and processed use. We applied X-LC to an analysis of K value and evaluated its performance in comparison with results of conventional HPLC.
Experimental
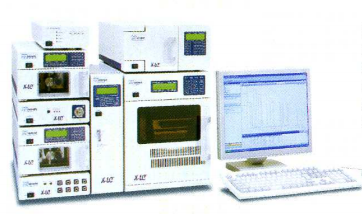
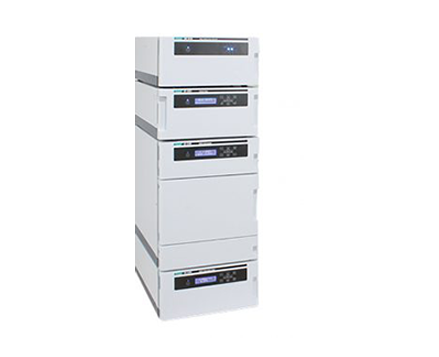
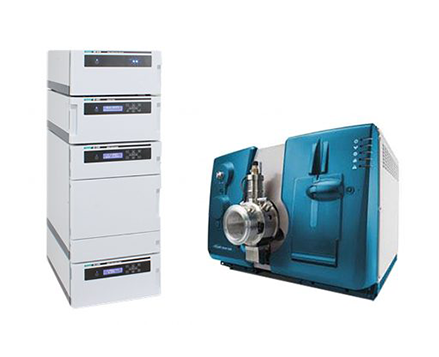
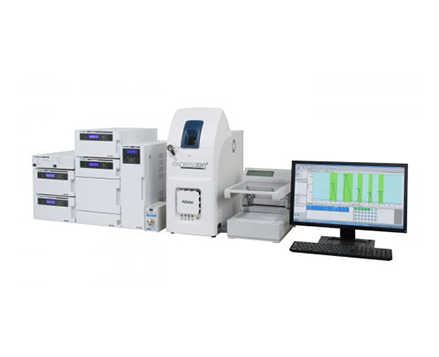
The chromatography system utilized in this experiment consists of JASCO X-LC series: two of 3185PU solvent delivery pump, 3080DG degasser, 3180MX high pressure mixing device, 3067CO column oven, 3070UV UV/Vis detector, 3159AS autosampler, and ChromNAV chromatography data system. Separation column used was a X-PressPak AQ-C18-W (3.0 mm ID x 50 mmL, 2µm). K value was obtained by a program calculation function in ChromNAV.
Pretreatment of fish meat was conducted in the following procedure:
- Add 0.4 M perchloric acid solution (20 mL) to fish meat (2.5 g) to homogenize.
- Centrifuge it at 3500 rpm for 10 min.
- Add 2 M potassium carbonate solution (1 mL) to the supernatant (5 mL) and centrifuge it at 3500 rpm for 5 min.
- Filter supernatant obtained at (3) with 0.45 µm membrane filter.
Keywords
420008XRE
Results
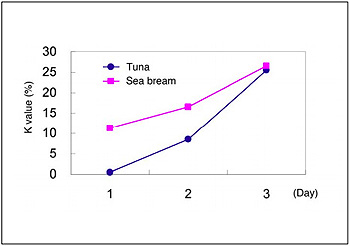
Figure 1 shows an X-LC chromatogram of standard mixture. X-LC succeeded in providing an analysis time eight times shorter than conventional HPLC. Figure 2 shows an X-LC chromatogram of tuna preserved for two days. As shown in this figure, six kinds of components provide a good separation without interfering with unknown components. K value of this sample was 8%. Figure 3 shows relationship between preservation days and K values of tuna and sea bream.
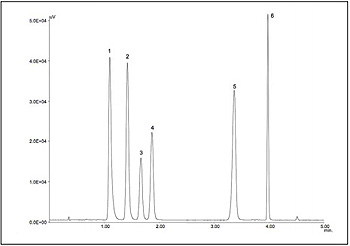
Peaks: 1=adenosine triphosphate (ATP), 2=adenosine diphosphaete (ADP), 3=inosinic acid (IMP), 4=hypoxanthine (Hypo),
5=adenosine monophosphate(AMP), 6=inosine (Ino) Chromatographic conditions:
Column=X-Presspak AQ-C18-W (3.0 mm ID x 50 mmL, 2.0 µm) Mobile phase: A=100mM phosphate buffer (pH 4.2),
B=100 mM phosphate buffer (pH 4.2)/ acetonitrile (50/50)
Gradient profile: 0min, A/B (100/0); 2.2 min, A/B (50/50); 7 min, A/B (50/50); 8.2 min, A/B (0/100); 8.3 min, A/B(100/0)
Flow rate: 0.6 mL/min Column temperature: 30°C Detection wavelength: 260 nm Injection volume: 1 µL (1nmol each)
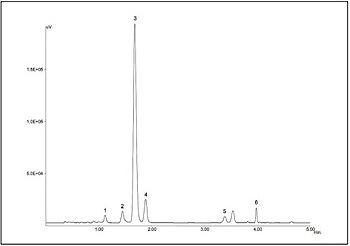
The pretreatment is describe in Experimental. The other conditions are the same as in Figure 1 caption.
Featured Products:

Speed Separation of ATP and its Degradation Products By X-LC
Introduction
ATP (adenosine triphosphate) in fish meat decomposes in a following process:
ATP -> ADP (adenosine diphosphate) -> AMP (adenosine monophosphate) -> Inosinic acid -> Inosine -> Hypoxanthine
A parameter “K value” indicates freshness of fish meat and is defined as:
K value(%) = [(Inosine + Hypoxanthine) / (ATP + ADP + AMP + Inosine + Hypoxanthine)] x 100
When K value is below 20 %, fish meat can be used for Sashimi (raw use) and 20% through 60% for cooked and processed use. We applied X-LC to an analysis of K value and evaluated its performance in comparison with results of conventional HPLC.
Experimental
The chromatography system utilized in this experiment consists of JASCO X-LC series: two of 3185PU solvent delivery pump, 3080DG degasser, 3180MX high pressure mixing device, 3067CO column oven, 3070UV UV/Vis detector, 3159AS autosampler, and ChromNAV chromatography data system. Separation column used was a X-PressPak AQ-C18-W (3.0 mm ID x 50 mmL, 2µm). K value was obtained by a program calculation function in ChromNAV.
Pretreatment of fish meat was conducted in the following procedure:
- Add 0.4 M perchloric acid solution (20 mL) to fish meat (2.5 g) to homogenize.
- Centrifuge it at 3500 rpm for 10 min.
- Add 2 M potassium carbonate solution (1 mL) to the supernatant (5 mL) and centrifuge it at 3500 rpm for 5 min.
- Filter supernatant obtained at (3) with 0.45 µm membrane filter.
Results
Figure 1 shows an X-LC chromatogram of standard mixture. X-LC succeeded in providing an analysis time eight times shorter than conventional HPLC. Figure 2 shows an X-LC chromatogram of tuna preserved for two days. As shown in this figure, six kinds of components provide a good separation without interfering with unknown components. K value of this sample was 8%. Figure 3 shows relationship between preservation days and K values of tuna and sea bream.
Peaks: 1=adenosine triphosphate (ATP), 2=adenosine diphosphaete (ADP), 3=inosinic acid (IMP), 4=hypoxanthine (Hypo),
5=adenosine monophosphate(AMP), 6=inosine (Ino) Chromatographic conditions:
Column=X-Presspak AQ-C18-W (3.0 mm ID x 50 mmL, 2.0 µm) Mobile phase: A=100mM phosphate buffer (pH 4.2),
B=100 mM phosphate buffer (pH 4.2)/ acetonitrile (50/50)
Gradient profile: 0min, A/B (100/0); 2.2 min, A/B (50/50); 7 min, A/B (50/50); 8.2 min, A/B (0/100); 8.3 min, A/B(100/0)
Flow rate: 0.6 mL/min Column temperature: 30°C Detection wavelength: 260 nm Injection volume: 1 µL (1nmol each)
The pretreatment is describe in Experimental. The other conditions are the same as in Figure 1 caption.
Keywords
420008XRE