Temperature-Dependent CD and Fluorescence Spectral Measurements of Lysozyme
January 5, 2024
 Download This Application
Introduction
Recently, there has been a significant increase in the research and manufacturing of biomedicines derived from proteins, which are becoming more widely available in the biopharmaceutical industry. An important requirement in the manufacturing and quality control of protein-based biopharmaceuticals is in the assessment of stability during storage and the effects of storage conditions. The measurement of denaturation and thermal stability are of considerable importance in guaranteeing the efficacy of biopharmaceuticals. CD measurement offers significant advantage in the assessment of protein secondary structure due to its requirement for small amount of sample coupled with high sensitivity measurement. Therefore, CD measurement is becoming one of the most popular techniques used in the analysis of the thermal stability and changes in protein structure caused by ionic strength and pH. The use of fluorescence spectroscopy in the probing tryptophan residues also yields important information about the tertiary structure of proteins.
This application note illustrates temperature-dependent CD and fluorescence measurements of lysozyme obtained simultaneously using the J-1500 CD spectrometer, FMO-522 Emission Monochromator accessory, and Temperature/Wavelength Scan Measurement program.
Experimental
| Measurement Conditions | |||
| CD | Fluorescence | ||
| Data Pitch | 0.5 nm | Data Interval | 2 nm |
| Bandwidth | 1 nm | Excitation Bandwidth | 1 nm |
| D.I.T. | 2 sec | Excitation Wavelength | 280 nm |
| Scan Speed | 100 nm/min | Emission Bandwidth | 10 nm |
| D.I.T. | 1 sec |
| Temperature Measurement | |||
| Temperature Range | 20-90°C | Gradient (Heating Range | 0.1°C |
| Wavelength | 222 nm | D.I.T. | 4 sec |
| Bandwidth | 1 nm |
An aqueous solution of 0.25 mg/mL of lysozyme, derived from egg white, was prepared and measured using a 5×5 mm rectangular quartz cell.
Keywords
210-CD-0023, J-1500, FMO-522 Emission monochromator, Circular dichroism, Fluorescence, Secondary structure, Tertiary structure, Thermal stability, Biochemistry
Results
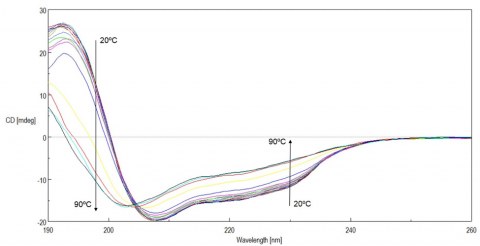
Figure 1 shows the temperature-dependent CD spectra of lysozyme. The data illustrate that the CD intensity decreases with increasing temperature and the negative maxima at 208 nm is shifted to 203 nm with increasing temperatures. These results indicate that the helical structure of the protein at room temperature converts to a more random structure at higher temperatures.
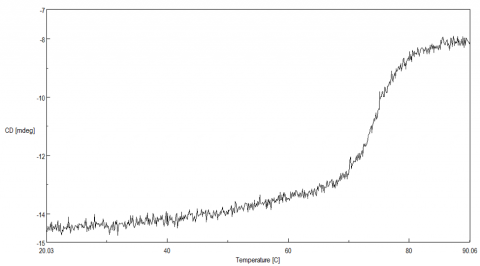
To determine the transition temperature of the secondary structure conversion, the CD signal was monitored at 222 nm as a function of temperature. Figure 2 illustrates that from 70 to 80ºC, the CD intensity drastically decreases and the melting temperature (Tm) was calculated to be 74.38ºC.
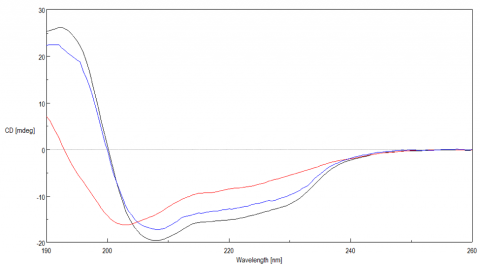
Once the initial melt was complete, the lysozyme solution was cooled back down to 20ºC, to verify folding was reversible. Figure 3 shows the CD spectrum of the initial 20ºC spectrum (black) compared with the spectrum measured at 90ºC (red) and at 20ºC after the melt (blue). The spectra before and after are very similar, indicating that the protein does refold once the temperature is reduced, however, the refolding process is not complete.
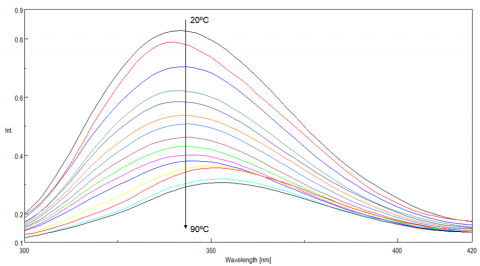
Tryptophan is commonly found in most proteins and has an emission maximum which is very sensitive to the polarity of its surrounding environment. In a nonpolar environment or when the residue is buried inside a protein, the fluorescence maximum is seen near 320 nm. Tryptophan in a polar environment or when it is solvent exposed, has an emission maximum near 350 nm. Figure 4 shows the temperature-dependent fluorescence spectra of lysozyme. Initially the emission maximum is at 340 nm but upon increasing temperatures, the peak is redshifted and at 90ºC is at 352 nm. This result indicates that the tryptophan residue commonly tucked away inside the interior of the protein at 20ºC moves to the periphery of the protein as it unfolds due to increasing temperatures.
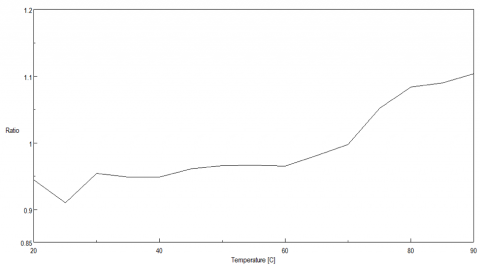
Figure 5 shows the peak ratio plot of the fluorescence intensity at 340 nm and 352 nm as a function of temperature. From 70 to 75ºC, the peak ratio significantly increases, indicating that the protein environment surrounding the tryptophan residues is altered and corroborating the melting temperature at 74ºC calculated from the CD data.
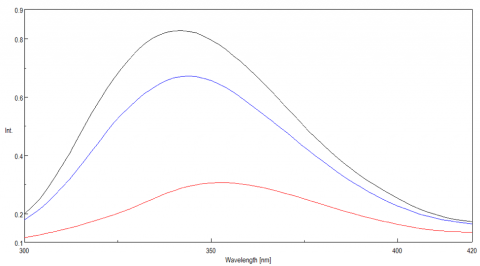
The ability of lysozyme to refold was also evaluated using fluorescence and the results are shown in Figure 6. They suggest that after cooling the protein, the lysozyme structure almost completely returns to its initial state, confirming the CD data which also indicate partial lysozyme refolding upon cooling.
References
1. S. V. Konev, “Fluorescence and Phosphorescence of Proteins and Nucleic Acids”, Plenum Press, New York, 1967.
Featured Products:

Temperature-Dependent CD and Fluorescence Spectral Measurements of Lysozyme
Introduction
Recently, there has been a significant increase in the research and manufacturing of biomedicines derived from proteins, which are becoming more widely available in the biopharmaceutical industry. An important requirement in the manufacturing and quality control of protein-based biopharmaceuticals is in the assessment of stability during storage and the effects of storage conditions. The measurement of denaturation and thermal stability are of considerable importance in guaranteeing the efficacy of biopharmaceuticals. CD measurement offers significant advantage in the assessment of protein secondary structure due to its requirement for small amount of sample coupled with high sensitivity measurement. Therefore, CD measurement is becoming one of the most popular techniques used in the analysis of the thermal stability and changes in protein structure caused by ionic strength and pH. The use of fluorescence spectroscopy in the probing tryptophan residues also yields important information about the tertiary structure of proteins.
This application note illustrates temperature-dependent CD and fluorescence measurements of lysozyme obtained simultaneously using the J-1500 CD spectrometer, FMO-522 Emission Monochromator accessory, and Temperature/Wavelength Scan Measurement program.
Experimental
| Measurement Conditions | |||
| CD | Fluorescence | ||
| Data Pitch | 0.5 nm | Data Interval | 2 nm |
| Bandwidth | 1 nm | Excitation Bandwidth | 1 nm |
| D.I.T. | 2 sec | Excitation Wavelength | 280 nm |
| Scan Speed | 100 nm/min | Emission Bandwidth | 10 nm |
| D.I.T. | 1 sec |
| Temperature Measurement | |||
| Temperature Range | 20-90°C | Gradient (Heating Range | 0.1°C |
| Wavelength | 222 nm | D.I.T. | 4 sec |
| Bandwidth | 1 nm |
An aqueous solution of 0.25 mg/mL of lysozyme, derived from egg white, was prepared and measured using a 5×5 mm rectangular quartz cell.
Results
Figure 1 shows the temperature-dependent CD spectra of lysozyme. The data illustrate that the CD intensity decreases with increasing temperature and the negative maxima at 208 nm is shifted to 203 nm with increasing temperatures. These results indicate that the helical structure of the protein at room temperature converts to a more random structure at higher temperatures.
To determine the transition temperature of the secondary structure conversion, the CD signal was monitored at 222 nm as a function of temperature. Figure 2 illustrates that from 70 to 80ºC, the CD intensity drastically decreases and the melting temperature (Tm) was calculated to be 74.38ºC.
Once the initial melt was complete, the lysozyme solution was cooled back down to 20ºC, to verify folding was reversible. Figure 3 shows the CD spectrum of the initial 20ºC spectrum (black) compared with the spectrum measured at 90ºC (red) and at 20ºC after the melt (blue). The spectra before and after are very similar, indicating that the protein does refold once the temperature is reduced, however, the refolding process is not complete.
Tryptophan is commonly found in most proteins and has an emission maximum which is very sensitive to the polarity of its surrounding environment. In a nonpolar environment or when the residue is buried inside a protein, the fluorescence maximum is seen near 320 nm. Tryptophan in a polar environment or when it is solvent exposed, has an emission maximum near 350 nm. Figure 4 shows the temperature-dependent fluorescence spectra of lysozyme. Initially the emission maximum is at 340 nm but upon increasing temperatures, the peak is redshifted and at 90ºC is at 352 nm. This result indicates that the tryptophan residue commonly tucked away inside the interior of the protein at 20ºC moves to the periphery of the protein as it unfolds due to increasing temperatures.
Figure 5 shows the peak ratio plot of the fluorescence intensity at 340 nm and 352 nm as a function of temperature. From 70 to 75ºC, the peak ratio significantly increases, indicating that the protein environment surrounding the tryptophan residues is altered and corroborating the melting temperature at 74ºC calculated from the CD data.
The ability of lysozyme to refold was also evaluated using fluorescence and the results are shown in Figure 6. They suggest that after cooling the protein, the lysozyme structure almost completely returns to its initial state, confirming the CD data which also indicate partial lysozyme refolding upon cooling.
Keywords
210-CD-0023, J-1500, FMO-522 Emission monochromator, Circular dichroism, Fluorescence, Secondary structure, Tertiary structure, Thermal stability, Biochemistry
References
1. S. V. Konev, “Fluorescence and Phosphorescence of Proteins and Nucleic Acids”, Plenum Press, New York, 1967.