The Use of Circular Dichroism Detection in SFC to Determine Enantiomeric Ratios without Peak Resolution
October 2, 2024
 Download This Application
Introduction
The determination of enantiomeric ratios is imperative in characterizing and studying the pharmacological effects of each enantiomer. The FDA requires individual testing of chiral drug molecules as significant differences in behavior between enantiomers in the body can occur as history has shown. Some enantiomers just differ in potency, but others can be inhibitive to each other and even some detrimental. In the 1950s one enantiomer of thalidomide was used against morning sickness, however, the other enantiomer caused birth defects1. Tuberculosis is treated with a variety of medications including the ethambutol (S,S)- (+) enantiomer, but the (R,R)-(-) enantiomer causes blindness2.
Currently, the time-consuming task of achieving baseline resolution of enantiomers is required for determining the enantiomeric purity. This typically requires SFC screening employing many columns and solvent combinations under a variety separation conditions. The resulting conditions are applicable to the separation of those specific enantiomers, while other racemic mixtures require a new solvent-column screen.
The circular dichroism detector (CD) measures the differential absorption of right and left circularly polarized light. Although enantiomers will absorb UV light equally, they will absorb right and left circularly polarized light differently. The ability to measure this differential absorption between the enantiomers will allow the determination of the enantiomeric ratio without resolving the peaks, thereby eliminating the time-consuming process of achieving enantiomeric separation.
The determination of the enantiomeric purity of these drugs is imperative since they are among many commercially available drugs that are offered as completely different drugs in the racemic and enantiomeric pure forms. To meet the FDA requirements for chiral drug production it is necessary to confirm the correct form of the chiral drug is being produced and the enantiomeric purity must be analyzed.
Experimental
Test compounds Flavanone, Trans Stilbene Oxide, (S)-(+)-Ketoprofen, Ketoprofen, Sulfamethazine were all purchased from Sigma-Aldrich (St. Louis, MO, USA). The columns used were obtained from Phenomenex and Chiral Technologies.
The JASCO SFC consisted of a CO2 pump, co-solvent pump, autosampler, column oven, UV detector, circular dichroism detector, Advion CMS-L, and back pressure regulator controlled under ChromNAV 2 software.
Keywords
SFC 2018, SFC, Circular Dichroism
Results
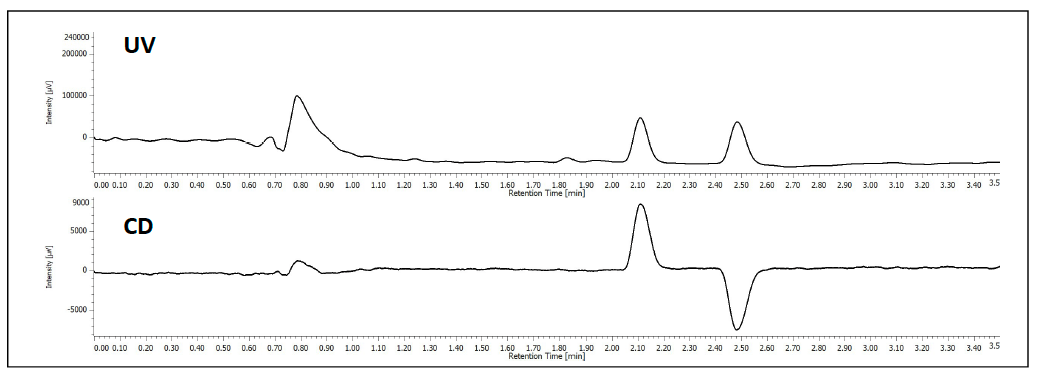
The separation of TSO is shown in figure 1. At 254nm the top chromatogram shows the separation of the 2 enantiomers and the bottom shows the differential, equal and opposite CD absorption of the enantiomer at 254nm.
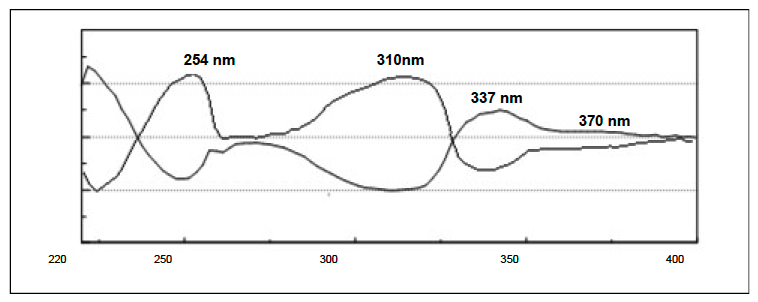
The individual flavanone enantiomers in figure 2 show the CD absorption spectrum of each. They show equal and opposite differential absorption at 254nm, 310nm, 337nm and 370nm.
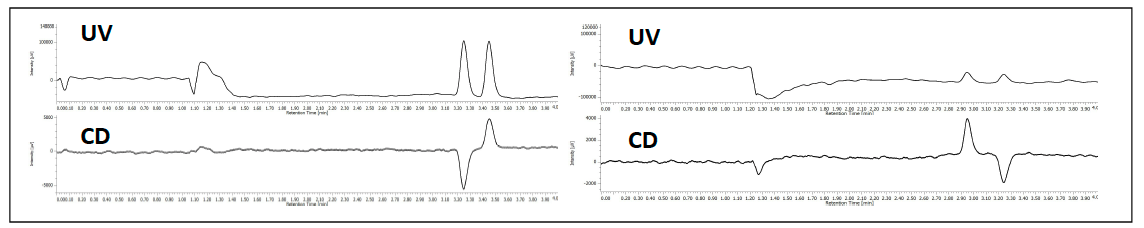
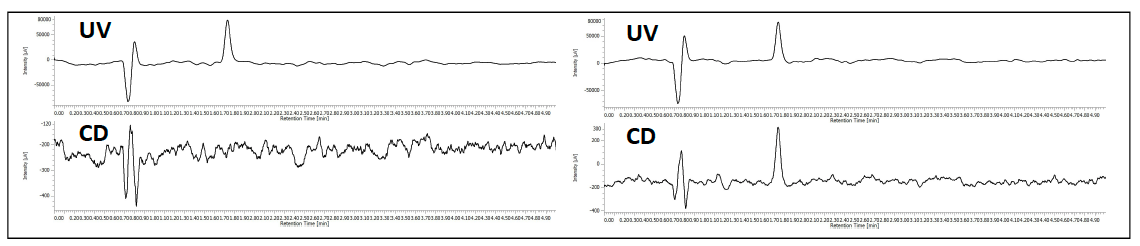
The enantiomeric separation of flavanone at 254nm and at 340nm is shown in figure 3. In this example the enantiomeric ratio can be determined to be 50:50 using either UV or CD. When the enantiomers co-elute, the UV shows the peak, however the equal and opposite CD absorption of the enantiomers cancel their signals as shown in the left chromatograms in figure 4. The (s)-(+)-ketoprofen is shown in the right chromatograms and demonstrate the CD signal from the pure enantiomer.
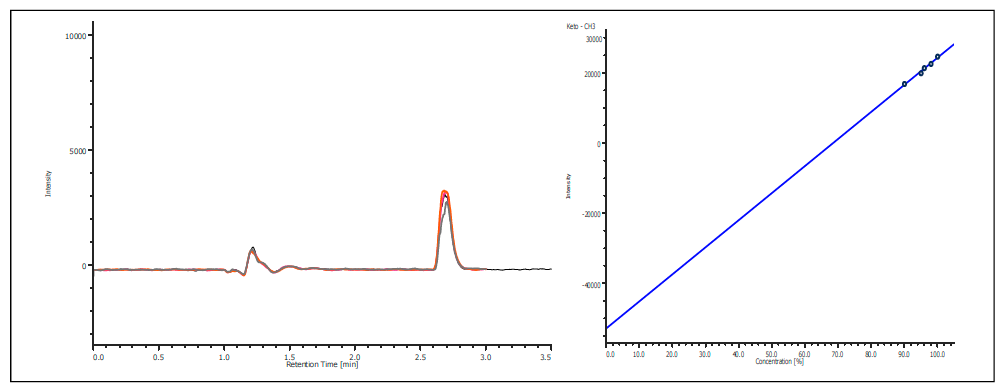
The co-elution of enantiomers would inhibit the ability to determine the enantiomeric excessive using UV, MS, or most detectors. However, the CD detector allows for determination of the enantiomeric ratio without resolution as shown in figure 5. The chromatogram shows the overlay of ketoprofen 90%, 96%, 97% 98% and 99% S. The calibration curve shows a correlation of 0.99.
The parallel 2 column screen of a mixture of flavanone, ketoprofen and sulfamethazine is shown in figure 6. The top TIC shows the detection of all 3 compounds from both columns as the run in parallel, but recombine before the MS. The 2nd and 3rd chromatograms are from column 1 through the CD detector at 310nm. The 4th chromatograms shows the 2nd column at 254nm. The CD detector shows the ability to identify the enantiomers during an achiral separation.
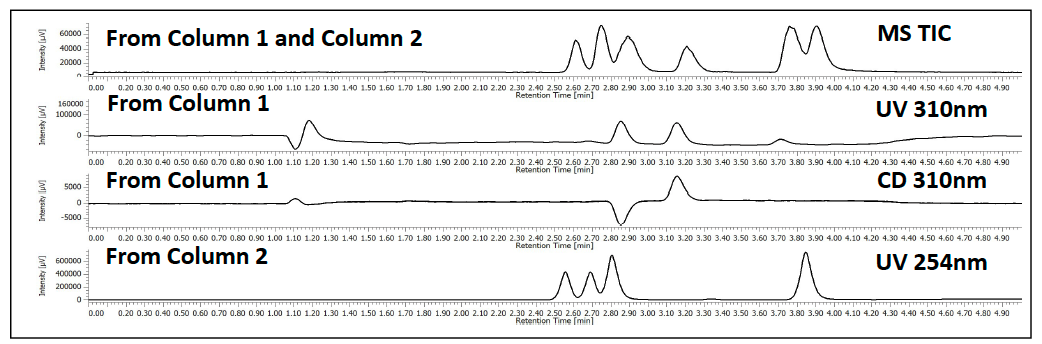
chromatograms, UV and CD signal, are from column 1. The 4th chromatogram is from the 2nd parallel column going to a UV detector.
Conclusion
Enantiomeric excess can only be determined by UV after baseline resolution of the enantiomers is achieved, which can be time consuming in screening columns and solvents. The CD detector provides the unique ability to determine that enantiomeric excess without the need for chromatographic separation of the enantiomers.
References
1. C. Blakemore and S. Jennett. The Oxford Companion to the Body. Oxford University Press. 2001.
2. N. Chhabra, M. Aseri and D. Padmanabhan. A review of drug isomerism and its significance. Int. J. Appl. Basic Med. Res. 2013. 3 (1). 16-18.
Featured Products:

The Use of Circular Dichroism Detection in SFC to Determine Enantiomeric Ratios without Peak Resolution
Introduction
The determination of enantiomeric ratios is imperative in characterizing and studying the pharmacological effects of each enantiomer. The FDA requires individual testing of chiral drug molecules as significant differences in behavior between enantiomers in the body can occur as history has shown. Some enantiomers just differ in potency, but others can be inhibitive to each other and even some detrimental. In the 1950s one enantiomer of thalidomide was used against morning sickness, however, the other enantiomer caused birth defects1. Tuberculosis is treated with a variety of medications including the ethambutol (S,S)- (+) enantiomer, but the (R,R)-(-) enantiomer causes blindness2.
Currently, the time-consuming task of achieving baseline resolution of enantiomers is required for determining the enantiomeric purity. This typically requires SFC screening employing many columns and solvent combinations under a variety separation conditions. The resulting conditions are applicable to the separation of those specific enantiomers, while other racemic mixtures require a new solvent-column screen.
The circular dichroism detector (CD) measures the differential absorption of right and left circularly polarized light. Although enantiomers will absorb UV light equally, they will absorb right and left circularly polarized light differently. The ability to measure this differential absorption between the enantiomers will allow the determination of the enantiomeric ratio without resolving the peaks, thereby eliminating the time-consuming process of achieving enantiomeric separation.
The determination of the enantiomeric purity of these drugs is imperative since they are among many commercially available drugs that are offered as completely different drugs in the racemic and enantiomeric pure forms. To meet the FDA requirements for chiral drug production it is necessary to confirm the correct form of the chiral drug is being produced and the enantiomeric purity must be analyzed.
Experimental
Test compounds Flavanone, Trans Stilbene Oxide, (S)-(+)-Ketoprofen, Ketoprofen, Sulfamethazine were all purchased from Sigma-Aldrich (St. Louis, MO, USA). The columns used were obtained from Phenomenex and Chiral Technologies.
The JASCO SFC consisted of a CO2 pump, co-solvent pump, autosampler, column oven, UV detector, circular dichroism detector, Advion CMS-L, and back pressure regulator controlled under ChromNAV 2 software.
Results
The separation of TSO is shown in figure 1. At 254nm the top chromatogram shows the separation of the 2 enantiomers and the bottom shows the differential, equal and opposite CD absorption of the enantiomer at 254nm.
The individual flavanone enantiomers in figure 2 show the CD absorption spectrum of each. They show equal and opposite differential absorption at 254nm, 310nm, 337nm and 370nm.
The enantiomeric separation of flavanone at 254nm and at 340nm is shown in figure 3. In this example the enantiomeric ratio can be determined to be 50:50 using either UV or CD. When the enantiomers co-elute, the UV shows the peak, however the equal and opposite CD absorption of the enantiomers cancel their signals as shown in the left chromatograms in figure 4. The (s)-(+)-ketoprofen is shown in the right chromatograms and demonstrate the CD signal from the pure enantiomer.
The co-elution of enantiomers would inhibit the ability to determine the enantiomeric excessive using UV, MS, or most detectors. However, the CD detector allows for determination of the enantiomeric ratio without resolution as shown in figure 5. The chromatogram shows the overlay of ketoprofen 90%, 96%, 97% 98% and 99% S. The calibration curve shows a correlation of 0.99.
The parallel 2 column screen of a mixture of flavanone, ketoprofen and sulfamethazine is shown in figure 6. The top TIC shows the detection of all 3 compounds from both columns as the run in parallel, but recombine before the MS. The 2nd and 3rd chromatograms are from column 1 through the CD detector at 310nm. The 4th chromatograms shows the 2nd column at 254nm. The CD detector shows the ability to identify the enantiomers during an achiral separation.
chromatograms, UV and CD signal, are from column 1. The 4th chromatogram is from the 2nd parallel column going to a UV detector.
Conclusion
Enantiomeric excess can only be determined by UV after baseline resolution of the enantiomers is achieved, which can be time consuming in screening columns and solvents. The CD detector provides the unique ability to determine that enantiomeric excess without the need for chromatographic separation of the enantiomers.
Keywords
SFC 2018, SFC, Circular Dichroism
References
1. C. Blakemore and S. Jennett. The Oxford Companion to the Body. Oxford University Press. 2001.
2. N. Chhabra, M. Aseri and D. Padmanabhan. A review of drug isomerism and its significance. Int. J. Appl. Basic Med. Res. 2013. 3 (1). 16-18.