Overview of the Various Options for Time Course Measurement using FTIR
April 25, 2024
 Download This Application
Introduction
FTIR offers three methods for time course measurement: interval measurement, rapid-scan, and step-scan; the time resolution is 1 sec, 50 msec, 5 msec (optional: 10 nsec) respectively.
Here we will review the basic features and measurement for each method. Each method uses a different type of scanning method for the moving mirror in the interferometer. “Interval measurement” is performed with regular scanning and “rapid-scan measurement” uses a faster scan rate of the moving mirror. Using “step-scan measurement,” the moving mirror stops at each data-sampling point and perturbed at each of the points.
Experimental
| Measurement Conditions | ||
| Interval Measurement *1 | Time Res.: 1 sec ~ | Application: structural transition of a sample, monitoring of gas concentration |
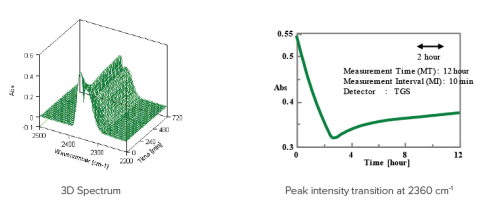
| Measurement Ex.: Measure the transition of CO2 concentration in room air. (Fig. 1) Interval measurement is effective for long-time monitoring of gas analysis. *1 JASCO interval measurement program can be used for up to 60001 scans or 24 days. | ||
| Rapid-Scan Measurement | Time Res.: 50 msec ~ | Application: photo-polymerization reaction, orientation relaxation of polymer film |
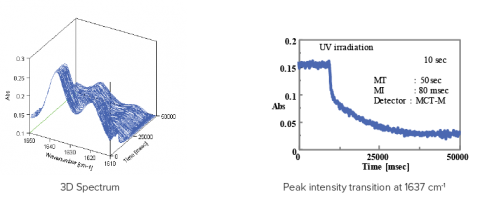
| Measurement Ex.: The curing process of a UV cured resin was measured, a photo-polymerization reaction. (Fig. 2) The peak intensity transition at 1637 cm-1 (bottom of Fig. 2) is attributed to the C=C stretch. The peak intensity rapidly decreased responding to the UV irradiation and continued to decrease moderately indicating that the initial reaction and reaction process for photo-polymerization was observed very accurately. | ||
| Step-Scan Measurement*2 | Time Res.: 5 msec ~*3 | Application: relaxation of liquid crystal orientation |
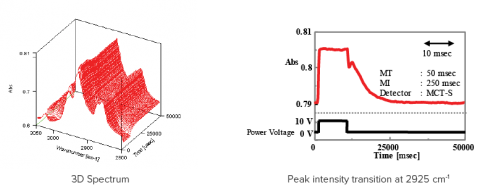
| Measurement Ex.: The relaxation process of the orientation of a liquid crystal in response to an electric field was measured. (Fig. 3) The peak intensity transition at 2925 cm-1 (bottom of Fig. 3), is attributed to the C-H stretch. The peak intensity fluctuated responding to the power voltage being applied and stopped, and decreased in two phases - rapidly and then moderately. It is known that the liquid crystal in the area near the electrode has a faster orientation relaxation than the bulk and this difference can be observed. *2 limited to the materials with repetitive response. *3 10 nsec ~ is optionally available. |
||
Keywords
280-SO-0007, FTIR, Step-scan, Rapid scan, Interval scan, resin curing, CO2,
Featured Products:


Overview of the Various Options for Time Course Measurement using FTIR
Introduction
FTIR offers three methods for time course measurement: interval measurement, rapid-scan, and step-scan; the time resolution is 1 sec, 50 msec, 5 msec (optional: 10 nsec) respectively.
Here we will review the basic features and measurement for each method. Each method uses a different type of scanning method for the moving mirror in the interferometer. “Interval measurement” is performed with regular scanning and “rapid-scan measurement” uses a faster scan rate of the moving mirror. Using “step-scan measurement,” the moving mirror stops at each data-sampling point and perturbed at each of the points.
Experimental
| Measurement Conditions | ||
| Interval Measurement *1 | Time Res.: 1 sec ~ | Application: structural transition of a sample, monitoring of gas concentration |
| Measurement Ex.: Measure the transition of CO2 concentration in room air. (Fig. 1) Interval measurement is effective for long-time monitoring of gas analysis. *1 JASCO interval measurement program can be used for up to 60001 scans or 24 days. | ||
| Rapid-Scan Measurement | Time Res.: 50 msec ~ | Application: photo-polymerization reaction, orientation relaxation of polymer film |
| Measurement Ex.: The curing process of a UV cured resin was measured, a photo-polymerization reaction. (Fig. 2) The peak intensity transition at 1637 cm-1 (bottom of Fig. 2) is attributed to the C=C stretch. The peak intensity rapidly decreased responding to the UV irradiation and continued to decrease moderately indicating that the initial reaction and reaction process for photo-polymerization was observed very accurately. | ||
| Step-Scan Measurement*2 | Time Res.: 5 msec ~*3 | Application: relaxation of liquid crystal orientation |
| Measurement Ex.: The relaxation process of the orientation of a liquid crystal in response to an electric field was measured. (Fig. 3) The peak intensity transition at 2925 cm-1 (bottom of Fig. 3), is attributed to the C-H stretch. The peak intensity fluctuated responding to the power voltage being applied and stopped, and decreased in two phases - rapidly and then moderately. It is known that the liquid crystal in the area near the electrode has a faster orientation relaxation than the bulk and this difference can be observed. *2 limited to the materials with repetitive response. *3 10 nsec ~ is optionally available. |
||
Keywords
280-SO-0007, FTIR, Step-scan, Rapid scan, Interval scan, resin curing, CO2,