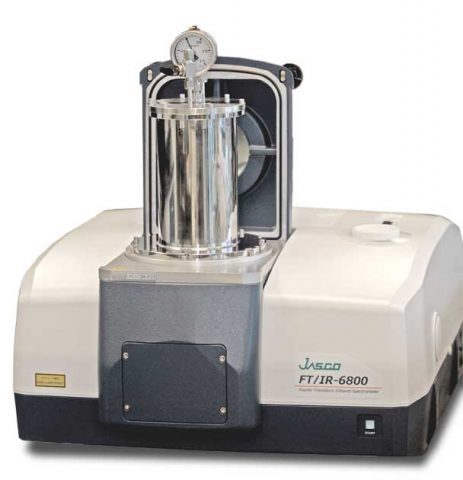
Full Vacuum FTIR Spectrometer for Quantitative Trace Gas Analysis (H2O in N2 Gas)
May 2, 2024
Introduction

Trace gas analysis requires the use of long path length gas cells, this has been been reported in a separate application note, however, it can be difficult to accurately quantitate gases at low concentrations when the absorption peaks of the target gas overlap with the peaks of atmospheric water vapor or, when the target gas itself is H2O or CO2, which are present in the atmosphere. This is because even with a vacuum FTIR spectrometer, it was not possible to evacuate the sample chamber with the long path length cell present. The FT/IR-6000 Series full vacuum gas analysis system introduced in this application note has a special gas cell integrated into the sample chamber, allowing the entire light path to remain under full vacuum with the gas cell in place. This full vacuum model makes it possible to quantitate concentrations of H2O even at levels as low as 0.2 ppm.
Experimental
For the measurement, a manifold with several vacuum lines is used for independent evacuation of the FT/IR-6800FV interferometer, detector chamber and sample compartment, as well as the gas cell. Adding a vacuum gauge to the gas cell makes it possible to control the loading of extremely low concentrations of gas samples.
Cell Specifications
| Cell Type | Multi-pass white cell |
| Path Length | 10 m |
| Cell Body | Stainless-steel |
| Cell Inner Surface | Electrochemically Polished |
| Mirror Material | Stainless-steel |
| Mirror Surface | Gold |
| O-ring | Viton |
| Window | CaF2 |
| Cell Volume | approx. 2 L |
| Gas In/Out Ports | 1/4" VCR |
| Heating | Available 100 deg C Max. |
Keywords
230-TR-0199
Results
The quantitation of a trace levels of water vapor (H2O) in CO2 in a cylinder was attempted. Water vapor with a concentration of 15.0 ppm was diluted by monitoring the pressure gauge during dilution of the standard samples with concentrations of 1.5, 3.0, 4.5, 6.0, 7.6 and 9.12 ppm. Figure 2 shows the IR spectra of water vapor for each concentration. The lowest detection limit calculated from the Signal to Noise ratio was approx. 0.2 – 0.3 ppm. The calibration curve in Figure 3 was created using the absorption peak at 1734 cm-1. As seen, the precise quantitation of low concentration can be made with this system.
Featured Products:

Full Vacuum FTIR Spectrometer for Quantitative Trace Gas Analysis (H2O in N2 Gas)
Introduction

Trace gas analysis requires the use of long path length gas cells, this has been been reported in a separate application note, however, it can be difficult to accurately quantitate gases at low concentrations when the absorption peaks of the target gas overlap with the peaks of atmospheric water vapor or, when the target gas itself is H2O or CO2, which are present in the atmosphere. This is because even with a vacuum FTIR spectrometer, it was not possible to evacuate the sample chamber with the long path length cell present. The FT/IR-6000 Series full vacuum gas analysis system introduced in this application note has a special gas cell integrated into the sample chamber, allowing the entire light path to remain under full vacuum with the gas cell in place. This full vacuum model makes it possible to quantitate concentrations of H2O even at levels as low as 0.2 ppm.
Experimental
For the measurement, a manifold with several vacuum lines is used for independent evacuation of the FT/IR-6800FV interferometer, detector chamber and sample compartment, as well as the gas cell. Adding a vacuum gauge to the gas cell makes it possible to control the loading of extremely low concentrations of gas samples.
Cell Specifications
| Cell Type | Multi-pass white cell |
| Path Length | 10 m |
| Cell Body | Stainless-steel |
| Cell Inner Surface | Electrochemically Polished |
| Mirror Material | Stainless-steel |
| Mirror Surface | Gold |
| O-ring | Viton |
| Window | CaF2 |
| Cell Volume | approx. 2 L |
| Gas In/Out Ports | 1/4" VCR |
| Heating | Available 100 deg C Max. |
Results
The quantitation of a trace levels of water vapor (H2O) in CO2 in a cylinder was attempted. Water vapor with a concentration of 15.0 ppm was diluted by monitoring the pressure gauge during dilution of the standard samples with concentrations of 1.5, 3.0, 4.5, 6.0, 7.6 and 9.12 ppm. Figure 2 shows the IR spectra of water vapor for each concentration. The lowest detection limit calculated from the Signal to Noise ratio was approx. 0.2 – 0.3 ppm. The calibration curve in Figure 3 was created using the absorption peak at 1734 cm-1. As seen, the precise quantitation of low concentration can be made with this system.
Keywords
230-TR-0199

 Download This Application
