Ultra High-Speed Analysis of Curcumin in Turmeric by UHPLC
January 5, 2024
Introduction
Curcumin is the principal curucuminoid of the popular Indian spice turmeric, which is a member of the polyphenols. It is well known that it has physiological effects such as anti-ulcer, antioxidant and anti-inflammatory activities. Turmeric curucuminoids contain curcumin as keto and enol types.
In this report, curcuminoids in turmeric were analyzed using Ultra High-Performance Liquid Chromatography (UHPLC) with PDA detector, which enables ultra high-speed data aquisition of 100 spectra/sec.
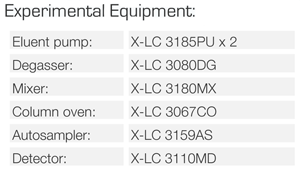
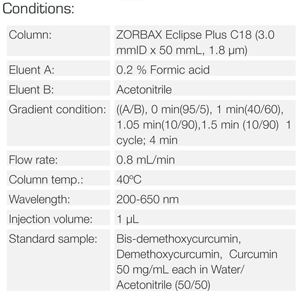
Experimental
Keywords
210004X
Results
Figure 1 shows the chromatogram and contour plot of the curcuminoid standard mixture. The components were clearly separated within 1 minute.
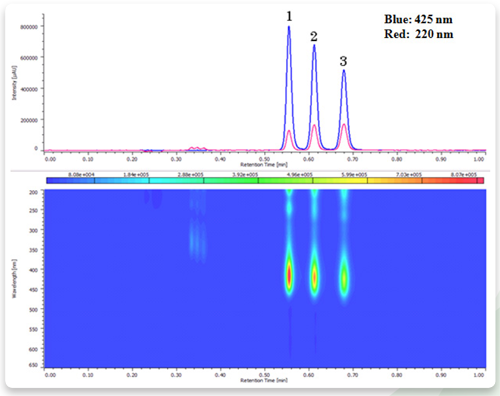
Figure 2 shows the on-peak spectra of the components of the curcuminoid standard. High quality spectra were obtained for all three components.
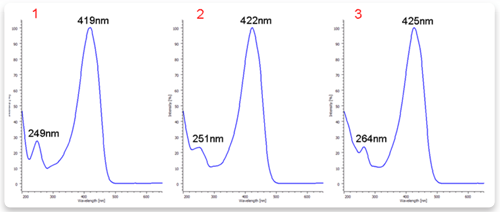
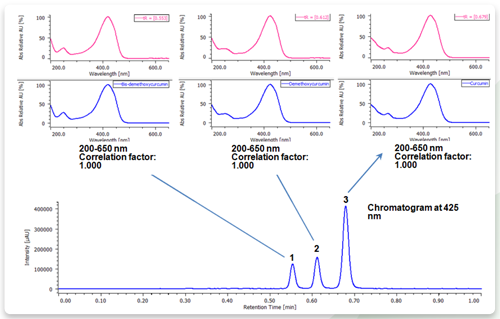
Figure 3 shows the chromatogram of commercial turmeric and the on-peak spectrum of each peak. By registering the spectra of standard components in figure 2, the correlation coefficient was calculated to be as good as 1.000.
Preparation: 500 milligrams of turmeric was first dissolved in 5 ml of acetonitrile. After sonication, the supernatant was filtered using 0.45 µm membrane filter, the filtrate was diluted with pure water (1:1) and it was filtered again using 0.2 µm membrane filter.
Featured Products:

Ultra High-Speed Analysis of Curcumin in Turmeric by UHPLC
Introduction
Curcumin is the principal curucuminoid of the popular Indian spice turmeric, which is a member of the polyphenols. It is well known that it has physiological effects such as anti-ulcer, antioxidant and anti-inflammatory activities. Turmeric curucuminoids contain curcumin as keto and enol types.
In this report, curcuminoids in turmeric were analyzed using Ultra High-Performance Liquid Chromatography (UHPLC) with PDA detector, which enables ultra high-speed data aquisition of 100 spectra/sec.

Experimental


Results
Figure 1 shows the chromatogram and contour plot of the curcuminoid standard mixture. The components were clearly separated within 1 minute.

Figure 2 shows the on-peak spectra of the components of the curcuminoid standard. High quality spectra were obtained for all three components.

Figure 3 shows the chromatogram of commercial turmeric and the on-peak spectrum of each peak. By registering the spectra of standard components in figure 2, the correlation coefficient was calculated to be as good as 1.000.

Preparation: 500 milligrams of turmeric was first dissolved in 5 ml of acetonitrile. After sonication, the supernatant was filtered using 0.45 µm membrane filter, the filtrate was diluted with pure water (1:1) and it was filtered again using 0.2 µm membrane filter.
Keywords
210004X

 Download This Application