Unfolding of Concanavalin A using Trifluoreoethanol Probed by Stopped-Flow CD Spectroscopy
January 5, 2024
 Download This Application
Introduction
One way to study protein structure is by observing the protein’s folding and unfolding processes. These events can span from submillisecond time scales to hours. While circular dichroism measurements can provide information regarding a protein’s secondary structure and the environment surrounding aromatic amino acids, stopped-flow techniques can be used to measure kinetic reactions that occur over a span of several millisecond to several seconds. By combining these techniques, researchers can analyse the structural kinetics of a protein’s unfolding and refolding processes.
Concanavalin A in its natural form is abundant in β-sheet structure. However, in the presence of trifluoroethanol (TFE), the structure folds into predominantly α-helices.
In this application note, the SFS-562T High-Speed StoppedFlow System was used in conjunction with the J-1500 CD spectrometer to measure the unfolding process of convanavalin A by TFE.
Experimental
| Measurement conditions | |
|---|---|
| Measurement wavelength | 220 nm |
| Path length | 2 mm |
| Spectral bandwidth | 1 nm |
| Data pitch | 2 msec |
| Accumulations | 4 |
| Response time | 1 msec |
| Syringe 1 (Concanavalin A) | 0.2 mg/mL in HCl (pH 2) |
| Syringe 2 | TFE |
| Mixing ratio | 100 µL: 100 µL |
| Total flow rate | 10 mL/sec |
Keywords
260-CD-0007, J-1500, Circular Dichroism, CD, stopped-flow, SFS-562T, secondary structure, concanavalin A, trifluoroethanol, kinetics, Reaction Speed Calculation program, biochemistry, material analysis, QA/QC, regulatory
Results
Figure 1 illustrates the CD spectra of folded and unfolded concanavalin A. In its native form, concanavalin A exhibits a predominantly β-sheet structure (green), while in a 50% TFE solution the protein is mostly α-helical.
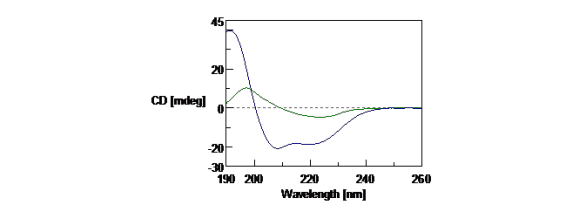
Figure 1. CD spectra of concanavalin A in HCl at pH 2 (green) and concanavalin A in solution with 50% TFE (blue). The CD spectra measurements were obtained with 0.1 mg/mL of concanavalin A in a 1 mm pathlength cell.
Concanavalin A (0.2 mg/mL in pH 2 HCl) was mixed with TFE in a 1:1 ratio. Its unfolding process was measured using stopped-flow CD at 220 nm, which is marker for α-helical structure. Figure 2 shows that the CD value at 220 nm decreases with time, indicating a change from β-sheet-rich structure to a α-helical-rich structure as the protein unfolds. This unfolding process was analyzed as a two-step reaction (A → B → C model) using the Reaction Speed Calculation (RSC) program. The results of the analysis are shown in Table 1. The black line in Figure 2 calculated from the RSC program demonstrates good fit of the stopped-flow data.
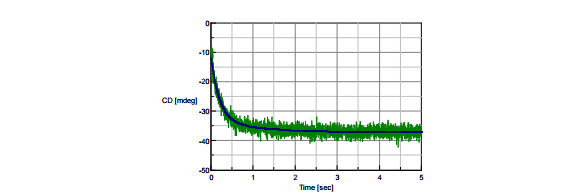
Figure 2. The unfolding process of concanavalin A in TFE measuremed by stopped-flow CD.
Table 1. Reaction speed calculations of the unfolding of concanavalin A using trifluoroethanol.
| Analysis results | |
|---|---|
| Reaction speed equation | Y(t) = 20.5925 * e(-t/0.189295) + 4.73648 * e(-t/0.903939) |
| Step 1 time constant (t1) | 0.189295 s |
| Step 1 rate constant (k1) | 5.28275 s-1 |
| Step 2 time constant (t2) | 0.903939 s |
| Step 2 rate constant (k2) | 1.10627 s-1 |
Conclusion
This application note demonstrates that stopped-flow CD measurements can be used to measure the protein unfolding processes, analyze the secondary structure changes, and obtain reaction rate constants.
References
1. Qi Xu and Timothy A. Keiderling, (2005) Biochemistry, 44, 7976-7987.
Featured Products:

Unfolding of Concanavalin A using Trifluoreoethanol Probed by Stopped-Flow CD Spectroscopy
Introduction
One way to study protein structure is by observing the protein’s folding and unfolding processes. These events can span from submillisecond time scales to hours. While circular dichroism measurements can provide information regarding a protein’s secondary structure and the environment surrounding aromatic amino acids, stopped-flow techniques can be used to measure kinetic reactions that occur over a span of several millisecond to several seconds. By combining these techniques, researchers can analyse the structural kinetics of a protein’s unfolding and refolding processes.
Concanavalin A in its natural form is abundant in β-sheet structure. However, in the presence of trifluoroethanol (TFE), the structure folds into predominantly α-helices.
In this application note, the SFS-562T High-Speed StoppedFlow System was used in conjunction with the J-1500 CD spectrometer to measure the unfolding process of convanavalin A by TFE.
Experimental
| Measurement conditions | |
|---|---|
| Measurement wavelength | 220 nm |
| Path length | 2 mm |
| Spectral bandwidth | 1 nm |
| Data pitch | 2 msec |
| Accumulations | 4 |
| Response time | 1 msec |
| Syringe 1 (Concanavalin A) | 0.2 mg/mL in HCl (pH 2) |
| Syringe 2 | TFE |
| Mixing ratio | 100 µL: 100 µL |
| Total flow rate | 10 mL/sec |
Results
Figure 1 illustrates the CD spectra of folded and unfolded concanavalin A. In its native form, concanavalin A exhibits a predominantly β-sheet structure (green), while in a 50% TFE solution the protein is mostly α-helical.
Figure 1. CD spectra of concanavalin A in HCl at pH 2 (green) and concanavalin A in solution with 50% TFE (blue). The CD spectra measurements were obtained with 0.1 mg/mL of concanavalin A in a 1 mm pathlength cell.
Concanavalin A (0.2 mg/mL in pH 2 HCl) was mixed with TFE in a 1:1 ratio. Its unfolding process was measured using stopped-flow CD at 220 nm, which is marker for α-helical structure. Figure 2 shows that the CD value at 220 nm decreases with time, indicating a change from β-sheet-rich structure to a α-helical-rich structure as the protein unfolds. This unfolding process was analyzed as a two-step reaction (A → B → C model) using the Reaction Speed Calculation (RSC) program. The results of the analysis are shown in Table 1. The black line in Figure 2 calculated from the RSC program demonstrates good fit of the stopped-flow data.
Figure 2. The unfolding process of concanavalin A in TFE measuremed by stopped-flow CD.
Table 1. Reaction speed calculations of the unfolding of concanavalin A using trifluoroethanol.
| Analysis results | |
|---|---|
| Reaction speed equation | Y(t) = 20.5925 * e(-t/0.189295) + 4.73648 * e(-t/0.903939) |
| Step 1 time constant (t1) | 0.189295 s |
| Step 1 rate constant (k1) | 5.28275 s-1 |
| Step 2 time constant (t2) | 0.903939 s |
| Step 2 rate constant (k2) | 1.10627 s-1 |
Conclusion
This application note demonstrates that stopped-flow CD measurements can be used to measure the protein unfolding processes, analyze the secondary structure changes, and obtain reaction rate constants.
Keywords
260-CD-0007, J-1500, Circular Dichroism, CD, stopped-flow, SFS-562T, secondary structure, concanavalin A, trifluoroethanol, kinetics, Reaction Speed Calculation program, biochemistry, material analysis, QA/QC, regulatory
References
1. Qi Xu and Timothy A. Keiderling, (2005) Biochemistry, 44, 7976-7987.