Water Analysis using a UV-Visible Spectrophotometer with a 30 cm Cell
August 15, 2022
 Download This Application
Introduction
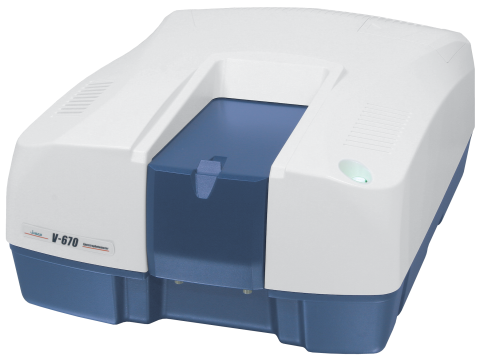
UV-Vis Spectrophotometer
Public and private water companies are required to test and purify potable and environmental water sources . However, the processes used in water treatment can produce carcinogenic biproducts which must be identified and removed for the purposes of health and water quality. Numerous testing procedures exist, the methods used for testing drinking water are based on color analysis, since this can indicate the concentration of humic materials that are precursors to carcinogenic trihalomethane. The simplest method of color analysis defined in testing methods for drinking water is a visual check with color comparison tubes. However, results using this method are subjective and depend on the observer’s perception and are not truly quantitative.
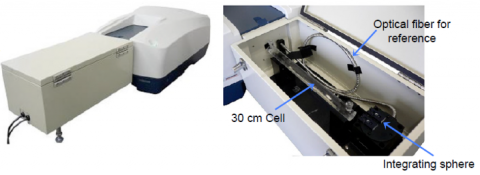
This application note introduces a new method to analyze superficially clean water using a UV-Visible spectrophotometer with a 30 cm pathlength cell. The extended sample compartment is dedicated to the 30 cm cylindrical cell (Figure 1), which provides precise measurements of samples with extremely low absorbance values that cannot be measured using a standard 10-100 mm path length cell. By placing an integrating sphere in the extended compartment, all transmitted light can be detected and integrated to achieve a maximum absorption signal.
Experimental
| Measurement Conditions | |||
| Measurement Range | 850-220 nm | Data Pitch | 0.5 nm |
| Slit Width | L5 nm | Response | Medium |
| Scanning Speed | 400 nm/min | ||
Keywords
UV-0005, V-650/660/670, UV-Visible/NIR spectrophotometer, Water Analysis, Color analysis Quantitation, Integrating sphere, Chromaticity
Results
Each water sample was measured using the 30 cm cell and subtracted using a baseline air measurement. The ultra-pure water provided the lowest absorbance throughout the entire wavelength range as seen in Figure 2. Since the ultrapure water is considered to be almost clear, the ultra-pure water spectrum was further employed as a reference to cancel any reflection or absorptions of the sample cell. The corrected spectra for each sample are displayed as Figure 3.
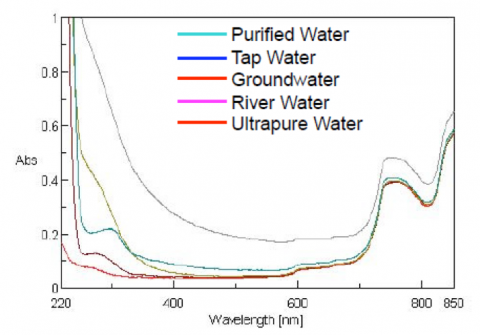
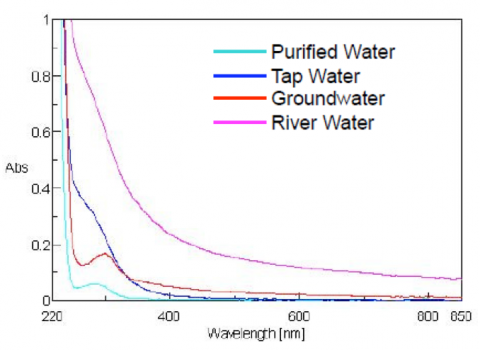
water samples.
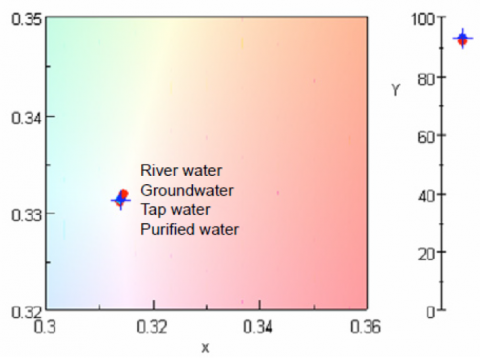
The results obtained with the 30 cm cell were analyzed using the [Color Diagnosis] program in Spectra Manager, and then plotted on a chromaticity diagram, shown in Figure 4. To demonstrate that the color differences of the water samples cannot be as clearly defined using the 10 mm cell, the samples were also measured with a 10 mm cell and the same calculation was performed, and shown in Figure 5.
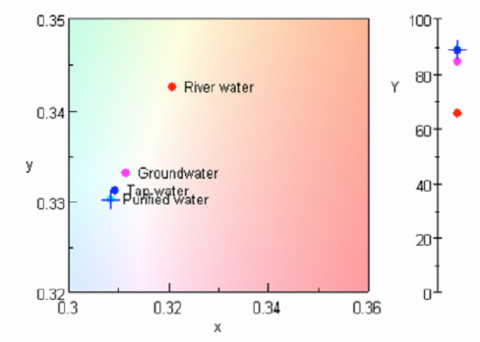
The chromaticity results indicate that river water is more yellow than the other water sources and most probably contains humic materials.
Conclusion
Using the JASCO 30 cm cell, the color of various water samples can be easily measured. This accessory is available for the measurement of extremely low concentration samples and for a wide variety of water analyses. The extended sample compartment can be applied not only for liquid samples, but also transparent rod shaped solid samples such as fibers.
Featured Products:
-
Modular UV-visible/NIR Spectrometer System
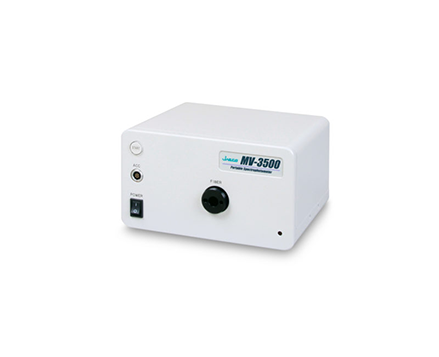
MV-3000 Series Portable UV-Visible/NIR Spectrophotometer
-
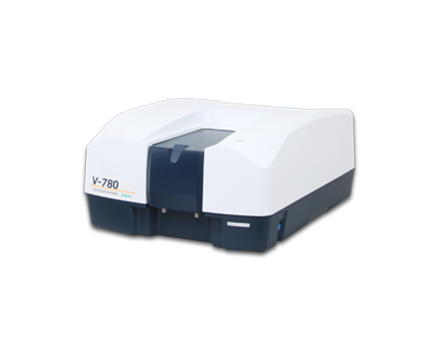
A high sensitivity UV-Visible/NIR Spectrophotometer with InGaAs detector for wavelengths up to1600nm
V-780 UV-Visible/NIR Spectrophotometer
-
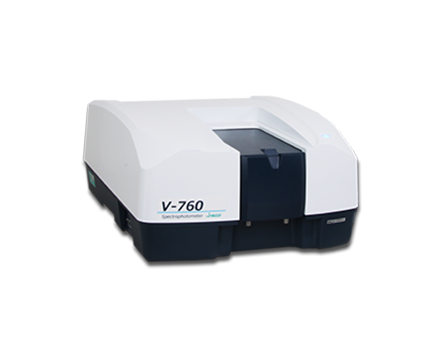
A high resolution UV-Visible double-beam, double-monochromator spectrophotometer with exceptional stray light and absorbance linearity
V-760 UV-Visible Spectrophotometer

Water Analysis using a UV-Visible Spectrophotometer with a 30 cm Cell
Introduction
UV-Vis Spectrophotometer
Public and private water companies are required to test and purify potable and environmental water sources . However, the processes used in water treatment can produce carcinogenic biproducts which must be identified and removed for the purposes of health and water quality. Numerous testing procedures exist, the methods used for testing drinking water are based on color analysis, since this can indicate the concentration of humic materials that are precursors to carcinogenic trihalomethane. The simplest method of color analysis defined in testing methods for drinking water is a visual check with color comparison tubes. However, results using this method are subjective and depend on the observer’s perception and are not truly quantitative.
This application note introduces a new method to analyze superficially clean water using a UV-Visible spectrophotometer with a 30 cm pathlength cell. The extended sample compartment is dedicated to the 30 cm cylindrical cell (Figure 1), which provides precise measurements of samples with extremely low absorbance values that cannot be measured using a standard 10-100 mm path length cell. By placing an integrating sphere in the extended compartment, all transmitted light can be detected and integrated to achieve a maximum absorption signal.
Experimental
| Measurement Conditions | |||
| Measurement Range | 850-220 nm | Data Pitch | 0.5 nm |
| Slit Width | L5 nm | Response | Medium |
| Scanning Speed | 400 nm/min | ||
Results
Each water sample was measured using the 30 cm cell and subtracted using a baseline air measurement. The ultra-pure water provided the lowest absorbance throughout the entire wavelength range as seen in Figure 2. Since the ultrapure water is considered to be almost clear, the ultra-pure water spectrum was further employed as a reference to cancel any reflection or absorptions of the sample cell. The corrected spectra for each sample are displayed as Figure 3.
water samples.
The results obtained with the 30 cm cell were analyzed using the [Color Diagnosis] program in Spectra Manager, and then plotted on a chromaticity diagram, shown in Figure 4. To demonstrate that the color differences of the water samples cannot be as clearly defined using the 10 mm cell, the samples were also measured with a 10 mm cell and the same calculation was performed, and shown in Figure 5.
The chromaticity results indicate that river water is more yellow than the other water sources and most probably contains humic materials.
Conclusion
Using the JASCO 30 cm cell, the color of various water samples can be easily measured. This accessory is available for the measurement of extremely low concentration samples and for a wide variety of water analyses. The extended sample compartment can be applied not only for liquid samples, but also transparent rod shaped solid samples such as fibers.
Keywords
UV-0005, V-650/660/670, UV-Visible/NIR spectrophotometer, Water Analysis, Color analysis Quantitation, Integrating sphere, Chromaticity