Sample Concentration and Path Length
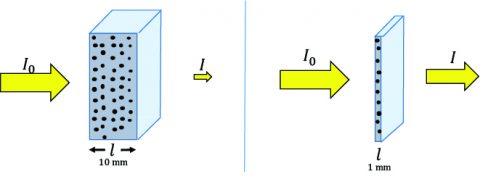
Since circular dichroism (CD) is an absorption technique based on Beer’s Law, the sample concentration and pathlength are critical for obtaining good CD data. If a sample is too concentrated or the path length is too long, the sample will absorb too much light, and not enough will pass to the detector for a reliable CD signal to be acquired. Conversely, if the sample is not concentrated enough or the cell path length is too short, the CD signal will be too weak or nonexistent. So what concentrations and path lengths are necessary to obtain good CD data? For secondary structure studies (180-250 nm), 0.1 mg/mL of sample in a 1 mm path length cell is recommended. Water becomes opaque in a 1 cm path length cell below 185 nm and many buffers and salts will absorb too strongly in a 1 cm cell to acquire a CD signal below 200 nm. For tertiary structure studies (250- 350 nm), 1 mg/mL of sample in a 1 cm path length cell is required. If the sample concentration cannot be diluted to ensure enough transmittance, the cell path length can be decreased. For instance, if the working sample concentration must be 1 mg/ mL, use a 0.1 mm path length cell instead. Usually, the concentration and path length conditions are optimized when the optical density is ~1, providing the best S/N.
Buffer Conditions
The buffer or solvent the sample is made up in will also affect the circular dichroism spectrum. Especially for secondary structures studies in the far-UV, an ideal buffer is one that has a low absorbance in the wavelength region being probed. The addition of salt to any buffer will increase absorbance and potentially cause scattering, reducing the S/N. Phosphate buffers (potassium or sodium) are good to start with. Denaturing agents also have high absorbance below 200 nm so many protein denaturation studies must be measured at wavelengths above 200 nm. Buffers with sugars not only absorb highly in the far-UV but also have a CD signal and should be avoided for CD measurements.
 High Tension (HT) Voltage
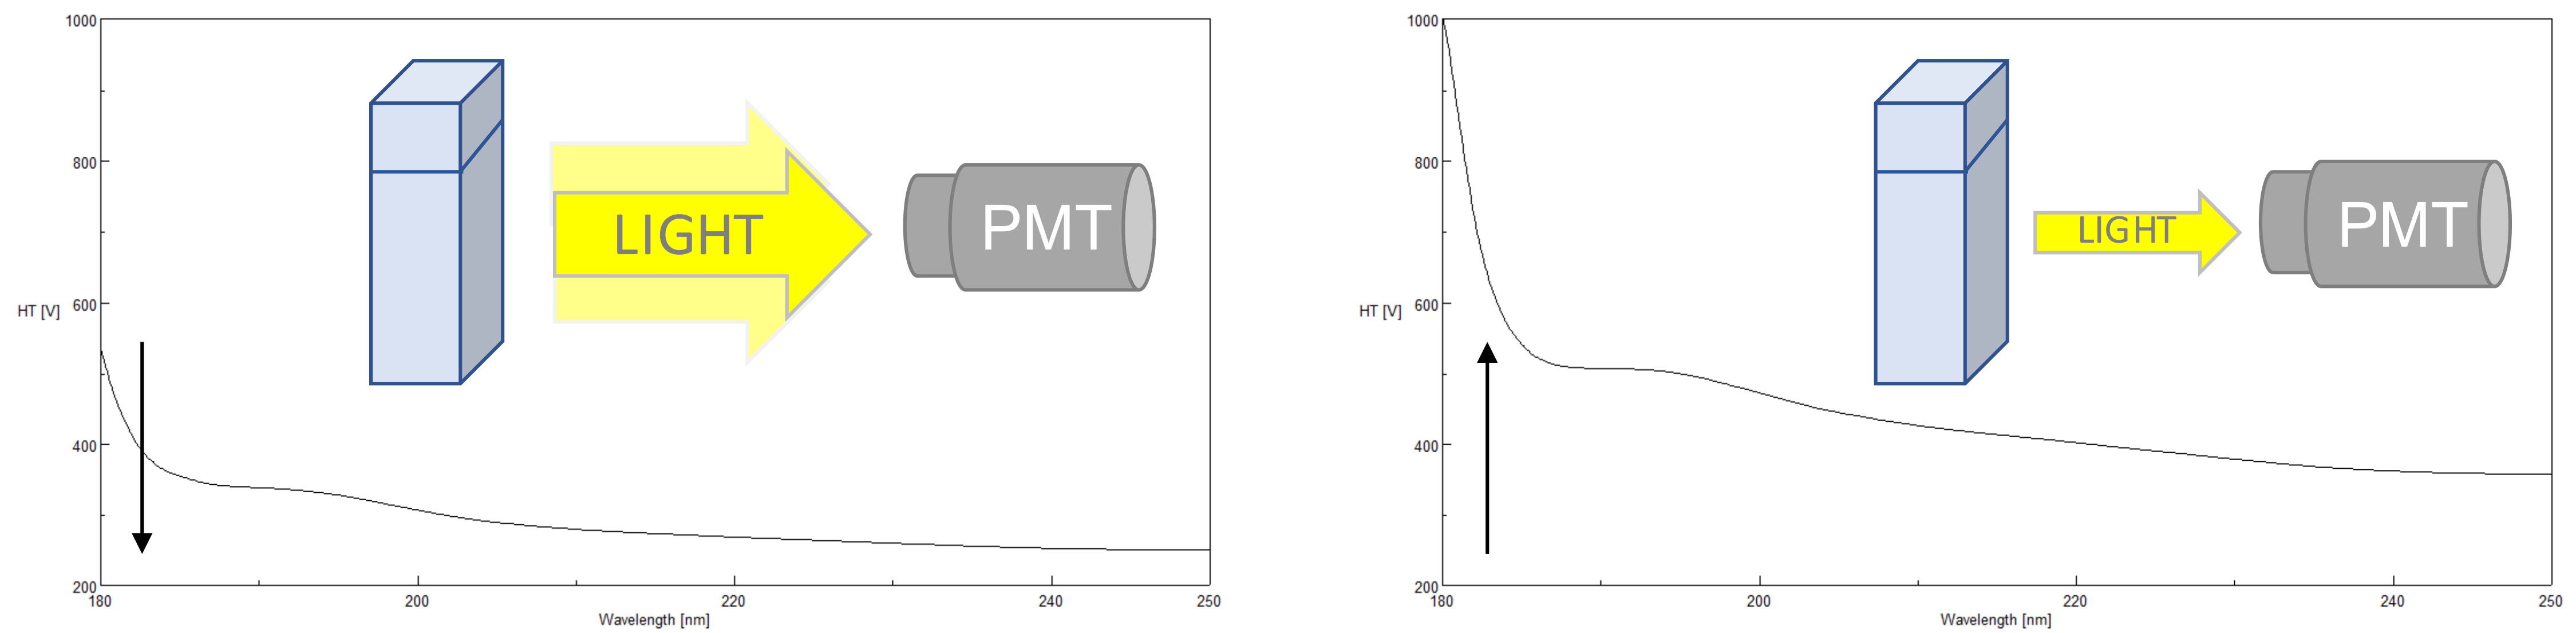
The photomultiplier tube (PMT) detector has great sensitivity combined with a very wide linear dynamic range and is the best solution for measurement of both low and high absorbing samples from the far UV to Visible regions of the spectrum. The HT voltage applied to the PMT is one of the most critical parameters to monitor in order to obtain good CD data. The applied HT voltage is used to amplify the detector’s sensitivity. Since different wavelengths have different light energies, the HT voltage accommodates fluctuations in the light levels by changing the gain. The gain either increases or decreases the amplitude of the signal depending on the DC voltage output. The standard DC is approx. 1 V. When a sample has an optimal concentration, enough light (photons) is transmitted through the sample and reaches the detector, keeping the gain low. However, if a sample absorbs too much light, not enough photons will reach the detector and the will gain be increased to amplify the signal and therefore the HT voltage will increase. If the HT voltage is equal to or above 700 V*, there are not enough photons being sampled by the PMT to measure a reliable or valid CD signal and the data points should not be used. The more photons reaching the detector, the better the S/N so at higher HT voltages, while the HT may be below 700 V, the CD signal may begin to look noisier. Additionally, farther into the far-UV (below 200 nm), less light is available so the HT voltage will also increase as the wavelength becomes shorter.
*for J-1000 Series Circular Dichroism Spectrometers
Digital Integration Time (D.I.T.)
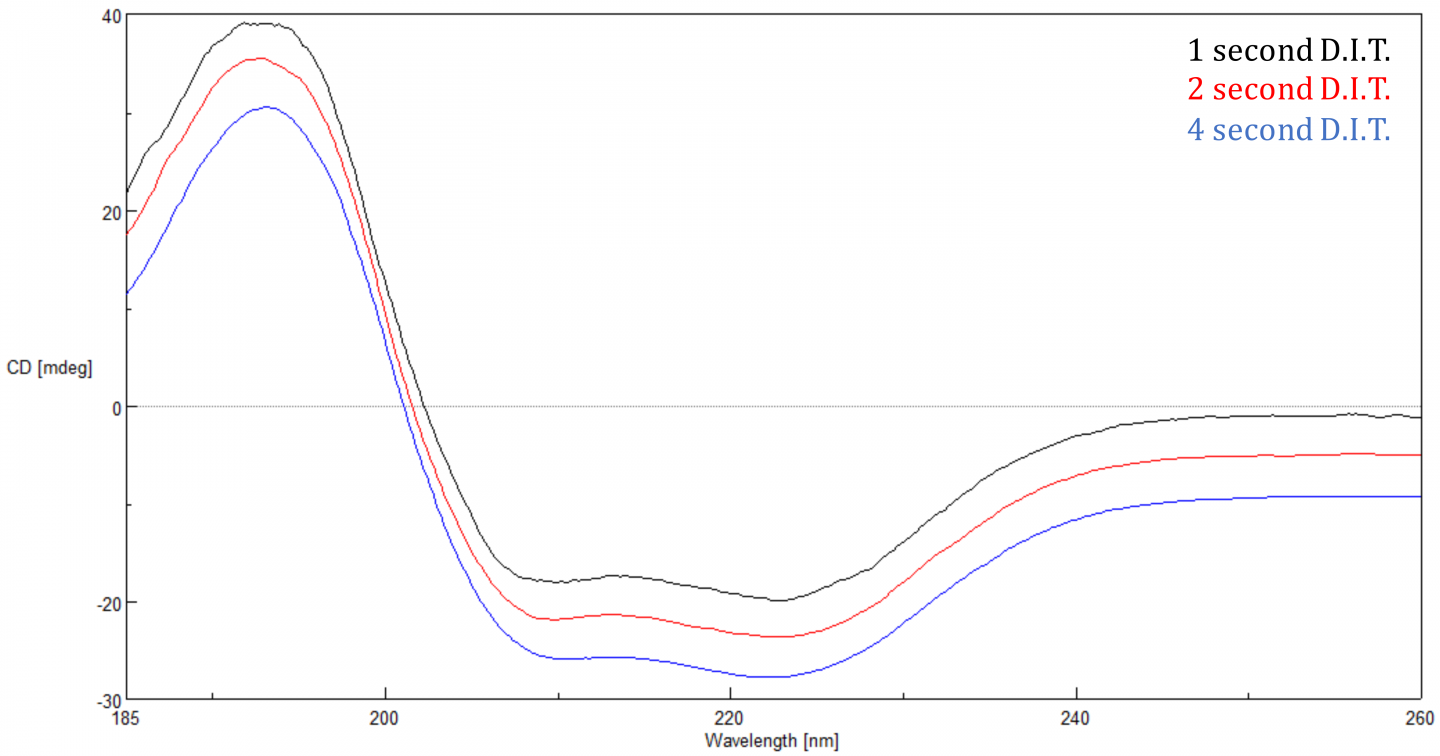
The Digital Integration Time or D.I.T. is the amount of time that the data is integrated over or the length of time the detector collects photons before transferring the signal to the A/D converter for processing. The S/N is proportional to the square root of the response so the longer the D.I.T., the better the S/N. Increasing the D.I.T. has a more substantial effect when a sample’s CD signal is small (<20 mdeg), since there is less signal. A 2 second D.I.T. with a 1 nm bandwidth is a good starting point.
Scanning Speed
The scanning speed determines how quickly the monochromator scans to acquire data points at the specified data interval. Since JASCO circular dichroism spectrophotometers offer a continuous scan mode (and step-scan mode), the D.I.T. must be taken into account when setting the scanning speed. Together the two parameters determine the response wavelength width that is obtained by multiplying the scanning speed (nm/sec) by the response (sec). To prevent distortion in the measured spectrum, the response wavelength width should be kept at less than 1/10 of the peak’s FWHM. A good starting scanning speed for biological samples is 50 nm/min.
Accumulations
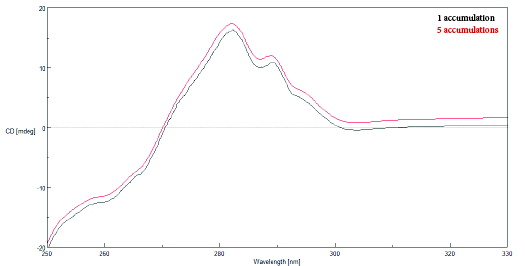
Spectral scans that are obtained and averaged together are referred to as ‘accumulations’. The following relationship exists between the signal-to-noise and the number of accumulations: S/N~√(Response x Number of Accumulations). Once the previous scanning parameters have been optimized, increasing the number of accumulations can therefore further reduce the noise in a spectrum.
Click here to request a full size poster for your lab.
Click here to download a printable pdf version.