
Choosing a Cuvette
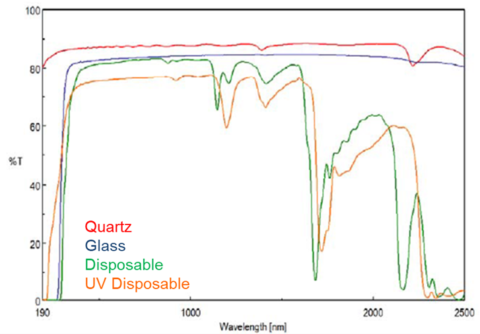
When choosing a suitable cuvette to use for your application, we need to consider the material of the cuvette and the volume of sample required. Figure 1 shows the transparency of different cuvette materials. For samples that absorb below 350 nm, quartz or UV disposable cuvettes are necessary. However, it’s advised to compare the disposable and quartz cuvettes options. Disposable cuvettes are made of plastics that still absorb so if the sample absorbs strongly and a higher photometric range is required, quartz cuvettes are a better choice. Disposable cuvettes are also not an option for the near-infrared measurements since the material absorbs above 1000 nm.
Cuvettes are also broken down into macro, micro, and sub-micro volumes. Assuming the pathlength is 1 cm, (the standard for most UV-Visible measurements), macro cells typically require 2.5-4 mL of sample and micro cells require 250 to 1000 mL of sample. Here the cuvette walls are tapered to accommodate smaller sample volumes. Sub-micro cells can hold 10 to 250 mL. However, these volumes will change with the pathlength of the cell, so longer pathlengths require more volume than shorter pathlengths. Micro and sub-micro cells also have self masking options, where the cuvette walls are black. The windows of micro and sub-micro cells are typically smaller than the standard beam dimension to accommodate smaller sample volumes. While the bandwidth of the instrument and therefore beam dimensions can be reduced, any light incident on the cell walls that does not pass through the sample can introduce stray light effects, resulting in inaccurate absorbance values and a reduction in photometric linearity. The z-height is also another important characteristic of cuvettes. The z-height is the height from the base of the cell to the center of the light beam and will differ for different instrument manufacturers. The z-height for the JASCO V-700 Series spectrophotometers is 15 mm.
Solvent Selection
Solvents and substrates should be carefully selected for UV-Visible/NIR experiments. If the sample is liquid, it should be soluble in the solvent selected and assist in maintaining sample stability. Ideally, the solvent or substrate should be transparent in the wavelength range where the sample’s chromophore absorbs, to reduce any additional absorbance that could potentially reach the limits of the instrument’s photometric range.
Response and Scanning Speed
The response is the amount of time that the data is integrated over or the length of time the detector collects photons before transferring the signal to the A/D converter for processing. The square root of the response is proportional to the signal to noise, so the longer the response the better the S/N. Increasing the response will have a more substantial effect when a sample’s signal is small since there is less light throughput.
The scanning speed determines how quickly the monochromator scans through the specified wavelength range to acquire data points at the specified data pitch. When used in continuous scan mode, the scanning speed must be selected with an appropriate response to prevent distortion in the measured spectrum. The following guideline can be used when selecting the response and scanning speed
Response × Scanning speed < FWHM/10
where FHWM is the full width at half the peak height of the target peak.
Performing Baseline Measurements
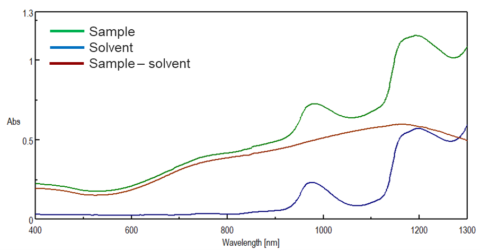
A baseline or background measurement is used to account for the solvent or buffer and the cell. For liquid samples or samples that are dissolved or diluted in solution and use a cuvette, the solvent and cuvette can absorb and reflect light which can lead to inaccurate absorbance values and lower signal to noise. This is especially important for quantitation measurements. In Figure 2, the sample, solvent, and solvent subtracted sample spectrum is shown and illustrates that neglecting to acquire a solvent spectrum can lead to incorrect identification of sample peaks and absorbance values.
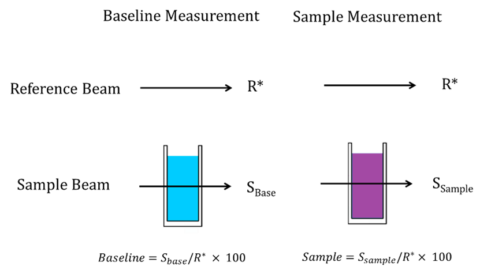
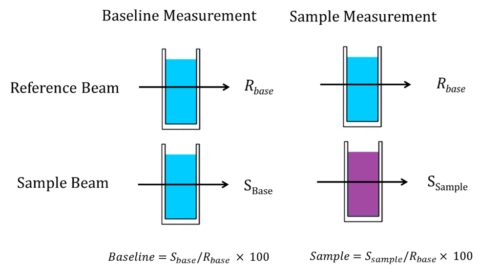
While all JASCO UV-visible/NIR spectrophotometers are double-beam instruments and have a reference beam, the main purpose of it is account for fluctuations in the light source, filter, light source and detector changes, and light attenuation of the sample, not solely for baseline measurements. The equation in Figure 3 shows that since the reference light intensity R* is canceled when calculating percent transmittance, the same result is obtained regardless of the presence or absence of a solvent on the reference light beam side. Therefore, for most samples, the baseline measurement of the solvent can be acquired with the solvent in the sample beam position, and then the sample is swapped with the solvent cuvette and the sample measurement acquired, also shown in Figure 20.
That being said, the reference beam does occasionally serve a purpose for baseline measurements. For samples with strong absorbances, the solvent can be placed in a cuvette in the reference beam for attenuation (rear-beam attenuation) to balance the intensity of the reference and sample beams since the detector is measuring low light intensities from the highly absorbing sample and very bright light intensity from the reference. Solvents whose properties change over time, such as oxidizing agents, should also be placed in the reference beam for both baseline and sample measurements. In this case, two matching cuvettes are used where the solvent is placed in both the reference and sample beam for the baseline measurement, shown in Figure 4. For the sample measurement, the sample is swapped into the sample beam position and the spectrum acquired.
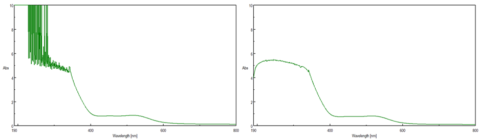
Rear Beam Attenuation
In the double-beam instrument, the reference beam can be attenuated by a neutral density filter with a transmittance of 1% to expand the photometric range. The addition of a neutral density filter to the reference beam balances the absorption by the sample so that the difference in the intensity of the reference and sample beams is not as great. This method is effective for samples with an absorbance of 3 or more. Figure 5 shows the absorbance spectrum of a highly absorbing sample without (left) and with (right) rear beam attenuation. The spectrum on the left becomes noisy and the absorbance maxes out at 10 AU, exceeding the photometric range of the instrument. However, when a 1 OD neutral density filter is placed in the reference beam, the actual absorbance of the sample and full photometric range of the instrument can now be acquired, along with a significantly better signal to noise ratio at lower wavelengths.