Measuring the Fluorescence Anisotropy Spectrum of Rhodamine B
January 5, 2024
Introduction
Fluorescence anisotropy can be observed when a fluorophore emits light of different intensities depending on the axes of polarization. When a molecule is excited by the absorption of light from its ground state to a transition state and relaxes to a stable vibrational state, it will then return back to its ground state by radiating fluorescence light. In this process there is a directionality, described by a transition dipole moment and determined by molecular structure, which is closely related to the direction of polarization of the excitation and fluorescence light. Fluorescence anisotropy offers insight about the rotational movement of fluorophores which cannot be obtained by fluorescence spectroscopy alone.
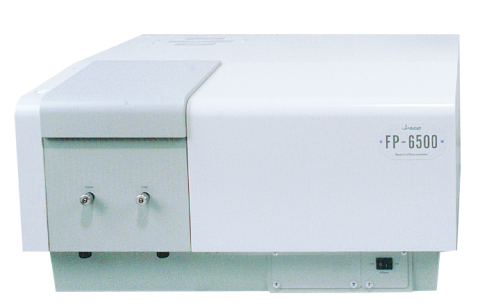
This application note illustrates the wavelength dispersion of the fluorescence anisotropy of rhodamine B using the FP-6500 automatic polarizers.
Experimental
Measurement Conditions
| Excitation Wavelength Range | 350 - 580 nm | Emission Wavelength | 625 nm |
| Excitation Bandwidth | 3 nm | Emission Bandwidth | 10 nm |
| Response Time | 0.5 sec | Data Interval | 0.2 nm |
| Sensitivity | Medium | Scan Speed | 200 nm/min |
Keywords
260-FP-0001, FP-6500, Fluorescence, Anisotropy, FDP-223 Polarizer,
Results
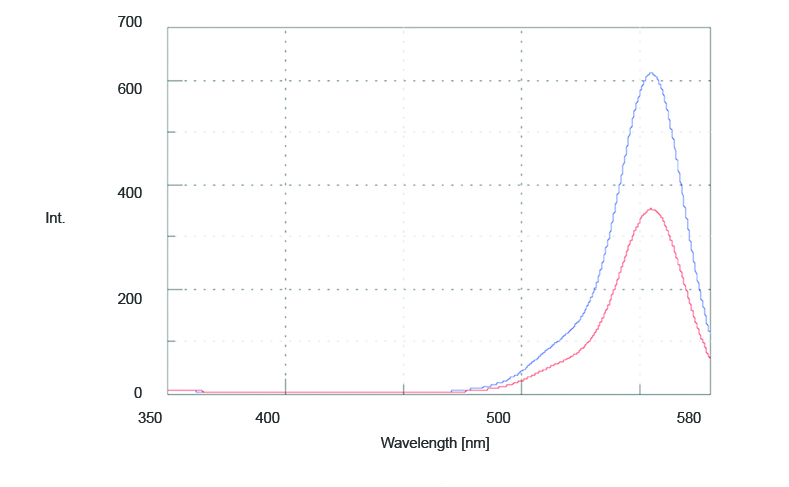
The fluorescence polarization spectrum of 0.588 mg/mL of rhodamine B in ethylene glycol was measured using the automatic polarizers. The fluorescence spectrum of IVV is obtained by placing both the excitation and emission polarizers in the vertical position and is shown in Figure 1 in blue. The spectrum of IVH is obtained by setting the excitation polarizer in the vertical position and the emission polarizer in the horizontal position. To correct for the sensitivity difference of the emission detector, the excitation polarizer is set in the horizontal position, the emission polarizer is set in the vertical position and a spectrum is measured. Then the emission polarizer is switched to the horizontal position and another spectrum is measured. The ratio of these two spectra is then multiplied by the IVH spectrum to obtain the corrected IVH spectrum and is shown in Figure 1 in red.
The fluorescence anisotropy (r) can then be calculated using the following equation:
![]()
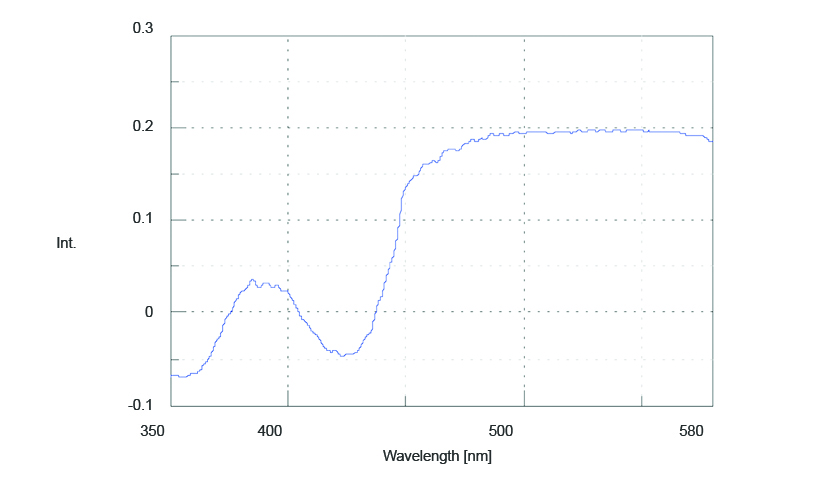
The excitation spectrum of the fluorescence anisotropy is seen in Figure 2. The spectrum shows an increase in anisotropy at longer wavelengths. The increased anisotropy values correspond to the absorption band at 560 nm (Figure 1), indicating a more immobilized molecular structure. Three peaks with small anisotropy values are also observed: two negative peaks at 360 and 430 nm and a positive peak at 380 nm, suggesting that different electronic transition bands are overlapped.
Conclusion
This application note demonstrates that the FP-6500 can be used with automatic polarizers to obtain the fluorescence anisotropy spectrum of rhodamine B in ethylene glycol.
Required Products and Software
- FP-8200/8300/8500/8600/8700 Spectrofluorometer
- FDP-223 Polarizer
Featured Products:
-
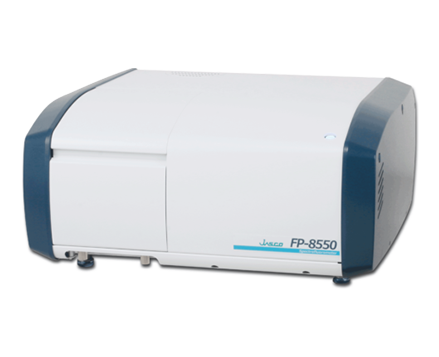
Sophisticated optical system offering the ultimate in sensitivity, spectral accuracy, and flexibility for the most challenging materials and biological samples.
FP-8550 Spectrofluorometer
-
FP-8650 NIR Spectrofluorometer

Measuring the Fluorescence Anisotropy Spectrum of Rhodamine B
Introduction

Fluorescence anisotropy can be observed when a fluorophore emits light of different intensities depending on the axes of polarization. When a molecule is excited by the absorption of light from its ground state to a transition state and relaxes to a stable vibrational state, it will then return back to its ground state by radiating fluorescence light. In this process there is a directionality, described by a transition dipole moment and determined by molecular structure, which is closely related to the direction of polarization of the excitation and fluorescence light. Fluorescence anisotropy offers insight about the rotational movement of fluorophores which cannot be obtained by fluorescence spectroscopy alone.
This application note illustrates the wavelength dispersion of the fluorescence anisotropy of rhodamine B using the FP-6500 automatic polarizers.
Experimental
Measurement Conditions
| Excitation Wavelength Range | 350 - 580 nm | Emission Wavelength | 625 nm |
| Excitation Bandwidth | 3 nm | Emission Bandwidth | 10 nm |
| Response Time | 0.5 sec | Data Interval | 0.2 nm |
| Sensitivity | Medium | Scan Speed | 200 nm/min |
Results
The fluorescence polarization spectrum of 0.588 mg/mL of rhodamine B in ethylene glycol was measured using the automatic polarizers. The fluorescence spectrum of IVV is obtained by placing both the excitation and emission polarizers in the vertical position and is shown in Figure 1 in blue. The spectrum of IVH is obtained by setting the excitation polarizer in the vertical position and the emission polarizer in the horizontal position. To correct for the sensitivity difference of the emission detector, the excitation polarizer is set in the horizontal position, the emission polarizer is set in the vertical position and a spectrum is measured. Then the emission polarizer is switched to the horizontal position and another spectrum is measured. The ratio of these two spectra is then multiplied by the IVH spectrum to obtain the corrected IVH spectrum and is shown in Figure 1 in red.


The fluorescence anisotropy (r) can then be calculated using the following equation:
![]()
The excitation spectrum of the fluorescence anisotropy is seen in Figure 2. The spectrum shows an increase in anisotropy at longer wavelengths. The increased anisotropy values correspond to the absorption band at 560 nm (Figure 1), indicating a more immobilized molecular structure. Three peaks with small anisotropy values are also observed: two negative peaks at 360 and 430 nm and a positive peak at 380 nm, suggesting that different electronic transition bands are overlapped.
Conclusion
This application note demonstrates that the FP-6500 can be used with automatic polarizers to obtain the fluorescence anisotropy spectrum of rhodamine B in ethylene glycol.
Keywords
260-FP-0001, FP-6500, Fluorescence, Anisotropy, FDP-223 Polarizer,
Required Products and Software
- FP-8200/8300/8500/8600/8700 Spectrofluorometer
- FDP-223 Polarizer

 Download This Application