Diffuse Reflectance and Integrating spheres
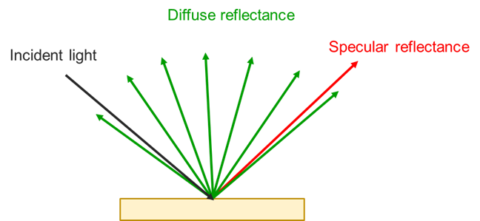
Aside from transmission and absorption, UV-Visible spectroscopy can also measure the diffuse reflectance of a sample, or how effective a surface is in reflecting the total amount of incident light. Reflection occurs when light strikes a material’s surface and causes a change in the direction of the light waves. There are two types of reflectance: specular and diffuse, where the sum of the two components is the total reflectance. Specular reflectance is light reflected at same angle as the incident beam and diffuse reflectance is light reflected in a different direction to the incident light, shown in Figure 1.
An integrating sphere is a spherical cavity whose inner wall is coated with a highly reflective material such as barium sulfate (Figure 2). In an integrating sphere, light undergoes multiple reflections until the reflected light enters the detector. The presence of a sample can change the optical path, as in the cases of scattering due to sample turbidity, non-planar samples, and thick samples. An integrating sphere is indispensable when the position and size of the light beam received by the detector change due to a change in the optical path, and the transmittance cannot be measured.

There are two types of measurements that can be made in an integrating sphere: diffuse transmission and diffuse reflectance. In diffuse transmission measurements (Figure 3), the incident light enters the sample compartment, where a mirror directs it through the sample sitting at the entrance of the sphere. The transmitted light is reflected by the diffuse surface of the integrating sphere and eventually makes its way through a third aperture to reach the detector. Diffuse reflectance measurements are obtained by placing the sample at the reflectance port of the integrating sphere, shown in Figure 3. Diffuse reflectance measurements are typically obtained for powder samples or samples with rough surfaces. Baseline measurements using an integrating sphere are straightforward: a ‘white’ standard (barium sulfate or Spectralon) plate is placed at the reflection of the sphere and the entrance port is left empty.
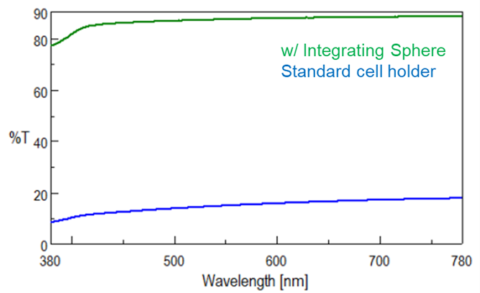
The spectra in Figure 4 show the transmittance of a sample using the standard cell holder (in blue) compared to spectra obtained using an integrating sphere, shown in green. Since only the direct transmittance was obtained using the standard cell holder, a significant portion of the transmittance was lost without the use of an integrating sphere.
Aside from a 60 mm diameter integrating sphere, JASCO also offers a 150 mm diameter sphere. Historically the larger sphere was required for international measurement guidelines like ASTM due to its port fraction, which is smaller than the 60 mm sphere. The port fraction describes the number of ports or apertures relative to the diameter of the sphere. This port fraction is also related to radiance produced from the multiple reflections in the sphere’s cavity. The smaller the port fraction, the better the sphere can integrate the radiant flux due more reflections or bounces. However, more reflections introduces more noise into the spectrum. The smaller 60 mm diameter sphere can now be used for ASTM measurements.
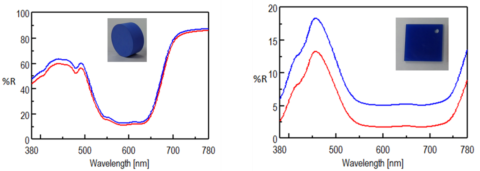
Additionally, in order to remove any potential specular component if only the diffuse reflectance is needed, a beam trap is added to the sphere to allow the specular component to exit the sphere. Specular components are typically acquired for shiny sample finishes while rougher surfaces have more diffuse reflectance. To measure the total reflectance of a sample, the specular component needs to be included and the beam trap is removed. Figure 5 illustrates the reflectance for a matte and glossy sample with and without the specular component. For the matte finish, the specular component adds relatively little to the total reflectance of the sample, but for the glossy sample, the inclusion of the specular component significantly increases the reflectance of the sample.
It is also important that the reference plates are kept clean and in good condition so their reflectance characteristics remain constant and do not contribute to incorrect reflectance values. Figure 6 shows the reflection spectrum of a dirty and clean white plate used as the reflection standard. If the standard is dirty, the reflectance, particularly in the ultraviolet region, decreases. If such a plate is used as a reference, the reflectance measured for a sample will be abnormally high.
