







UV-Visible Spectroscopy
UV-Visible/NIR spectroscopy (UV-Vis-NIR Spectroscopy) can be divided into ultraviolet, visible, and near-infrared regions of the spectrum. The ultraviolet region is defined as 180 to 400 nm, visible between 400 and 780 nm, and the near-infrared is from 800 to 3200 nm.

In the UV-Visible region the electronic absorption of a sample is measured. The Near Infrared frequencies overlap with the overtone frequencies of many natural vibrations, making it useful for sample identification. By measuring which wavelengths are absorbed and how strongly, the identity and concentrations of compounds can be determined. UV-Vis-NIR spectroscopy is an effective non-destructive method, useful for determining the sugar, lipid, and protein content of foodstuffs and for identifying medicinals.
Principle of UV-VIS Spectroscopy
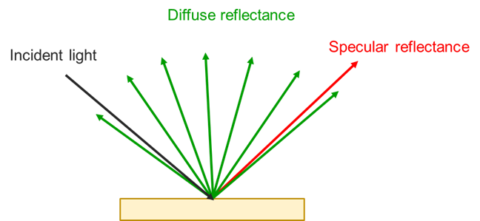
UV-Visible spectroscopy exploits the wave-like nature of electrons and its interactions with electromagnetic radiation. UV-Vis spectroscopic instruments are used to identify, characterize, and quantify an extraordinary wide range of molecular compounds. When a material is irradiated with an electromagnetic wave, phenomena such as transmission, absorption, reflection, and scattering can occur. Absorption occurs when the energy of incoming light is equal to the energy difference (ΔE) or energy gap between a molecule’s ground and excited states. The excitation of an electron from the ground state to an excited state is described as an electronic transition (Figure 2).
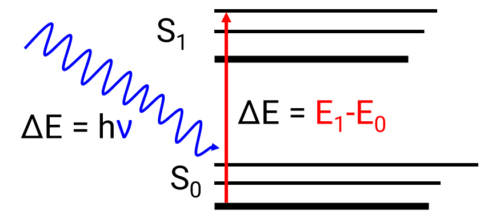
The relationship between the energy difference and wavelength is described by the Planck equation.
E=hν=hc/λ
where E is the energy required to promote an electron from the ground to an excited state, h is Planck’s constant, ν is the frequency, c is the speed of light, and λ is the wavelength.
Planck’s equation demonstrates that the less energy needed to excite the electrons, the longer the wavelength of the absorption band. The absorption bands are indicative of the molecular structure of the sample and will shift in wavelength and intensity depending on the molecular interaction and environmental conditions. These bands are typically broad and featureless due to the numerous molecular vibrational levels associated with the electronic energy levels.
Molecularly the transitions seen with UV-Vis are dependent on the electronic orbitals of substances. But some examples of transition types are:
- π → π* and n → π* transitions in organic chromophores (conjugated systems, carbonyl groups, aromatic rings)
- d–d electronic transitions in transition metal coordination complexes, responsible for their characteristic colors
- Charge-transfer transitions in metal complexes and donor–acceptor systems
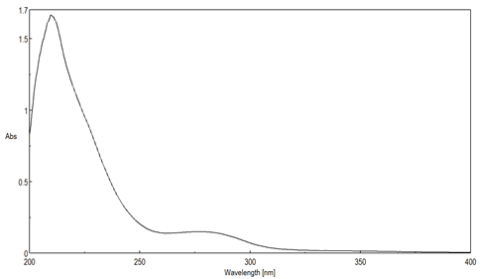
Near-infrared light is generally poorly absorbed because its photon energy is insufficient to induce electronic transitions and its frequency is greater than the natural vibration frequency of most chemical bonds. However, since the frequency in the NIR is close to the overtone frequency of many natural vibrations, weak substance-specific absorption bands can be detected.
Beer-Lambert Law
A UV-Visible/NIR spectrophotometer measures the transmittance (T) or the amount of light transmitted through a sample by calculating the ratio of the transmitted light intensity (I) to the incident light intensity (I₀).
T= I/I0
Which can also be written as a percentage of transmittance
%T = (I/I0)*100
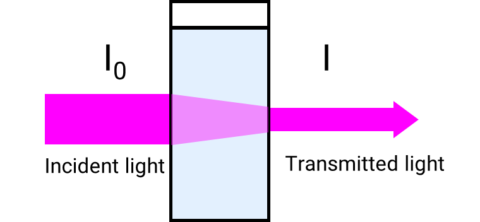
The relationship between transmittance and absorbance is described by the following equation
abs = 2-log (I/I0 ∙ 100) = 2-log (%T)
Absorbance measurements are frequently used to quantify an unknown sample’s concentration by exploiting the Beer-Lambert Law which describes how light is attenuated based on the materials it passes through. The transmittance, and therefore the absorbance, are directly proportional to a sample’s concentration, c, molar absorptivity, ε , and cuvette pathlength, l.
A= εcl
The amount of light absorbed by the sample depends on the number of molecules interacted with. The more concentrated a sample is, the more molecules are present and the higher the absorbance. Likewise, the longer the pathlength of the cell, the greater the distance that the light travels through the sample, increasing the number of molecules interacted with and therefore the absorbance. To compare the absorbances of two solutions with either different concentrations or pathlengths, there needs to be a constant variable to normalize the data on. Additionally, to determine a sample’s concentration by measuring absorbance, the cell pathlength and the strength of the electronic transition of the chromophore must be known. This constant or the probability of the electronic transition occurring is the molar absorptivity. Since molecules have different electronic transitions of varying strengths, the molar absorptivity will vary depending on the transition being probed and is, therefore, wavelength dependent.
Because Beer’s law provides a linear relationship between concentration and absorbance, often UV-Vis is used to build calibration curves. The wavelength of highest absorbance, or λmax, is used in this case. For known concentrations of sample the absorbance can be plotted, Abs vs. concentration. The plot is then fit to a linear curve Abs = m c +b, where the slope m is εl.
The Beer-Lambert law holds under the following conditions:
- Dilute solutions in the instruments linear range.
- No intermolecular interactions between absorbers.
- Aggregation can often lead to red or blue shifting where the λmax moves wavelength.
- The sample does not scatter light or have significant emission.
- Path length is held constant throughout the measurement.