
Instrumentation of a UV-Visible Spectrophotometer
The principle of measurement for UV-Visible Spectroscopy or UV-Visible spectrophotometer is relatively straightforward and consists of a light source, a wavelength dispersive element, sample, and detector.
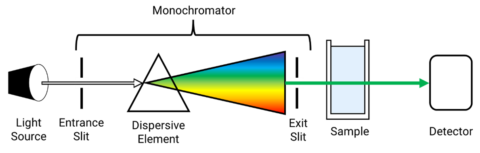
UV-Visible Spectrophotometer Monochromator
The monochromator itself houses the mirrors, slits, and grating. panchromatic light from a light source is introduced into the monochromator through the entrance slit and collimated onto a diffraction grating which is rotated to select discrete wavelengths. The light is then refocused by another mirror onto the exit slit so that can be adjusted to control the spectral bandwidth (SBW). The light is then refocused by another series of mirrors and directed to the sample where it is either transmitted, absorbed, or reflected.
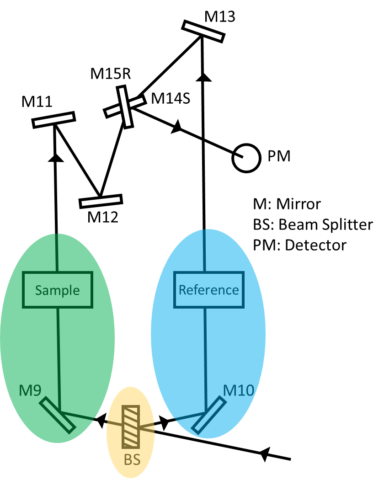
There are two types of optical arrangements: single and double beam. In the single-beam configuration, the monochromator, sample, and detector are arranged in series and the obtained monochromatic light with intensity I0 irradiates a sample and the transmitted light with intensity I is detected. Here, I/I0 is the transmittance. Although the optical system is simple, it is easily affected by fluctuations in the light source, and a blank measurement is required for each measurement. In a double beam configuration, monochromatic light is divided into two beams by a fixed or dynamic beam splitter, and the individual beams pass through a sample and a reference and detected, shown in figure 2. The light source intensity changes with time so the reference beam monitors the lamp energy and accounts for energy differences from voltage fluctuations, lamp drift, and stray light. By splitting the optical path, the incident and transmitted light can be measured simultaneously, compensating for the effects of light source fluctuations. Therefore, the measured absorbance is the ratio of the sample beam to the reference beam.
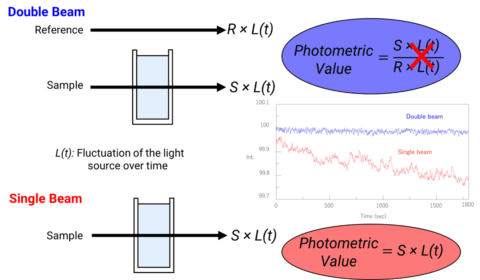
The image below in Figure 3 represents the sample compartment for a single and double beam instrument. In the double beam instrument, the photometric value is the ratio of the sample to reference beam so any fluctuations in the light source are canceled out. However, in a single beam instrument since there is only one beam, a ratio of the intensities cannot be acquired and the influence of the light source fluctuations can be seen in the spectra on the right, depicting the light intensity as a function of time for a single beam (red) and double beam (blue) instrument. As time progresses, the signal intensity in the single beam instrument begins to decrease while the double beam spectrum provides a consistent baseline.
Light Sources for a UV-Visible Spectrophotometer
When selecting and evaluating an instrument, the type of light source used will have an effect on UV-Visible/NIR measurements. A few things to consider are: (1) the operational wavelength range required for the application or where the sample’s chromophore absorbs, (2) the required light throughput, (3) the stability of the source, and (4) the cost and lifetime of the source.
JASCO spectrophotometers use deuterium and halogen light sources. The deuterium lamp is used for the UV region from 190 to 350 nm while the halogen lamp covers a much broader spectral range from 330 and 3200 nm. Both the deuterium and halogen lamps used are continuous sources, although the D2 is also a line source. In continuous sources, the arc created excites the molecules enclosed in the vacuum to a higher energy state. The relaxation of the electrons back to the ground state emits photons and as the electrons return to the ground state, the excitation process restarts, providing a continuous source of light. Continuous sources therefore provide a uniform amount of light through the monochromator to the sample. While this constant output of light can potentially lead to photobleaching of light sensitive samples, shutters can be implemented so the sample is only irradiated with light during the measurement itself.
Grating
The grating is a dispersive element used to select the wavelengths required to probe the electronic transitions of a sample’s chromophores. It is rotated to the wavelengths selected and diffracts the light into several beams. The direction that light is diffracted depends on the angle and wavelength of the incident beam, and the grating’s groove (or line) frequency, or the number of grooves on the grating per millimeter.
The spacing between the grooves determines the diffraction order of the light, or how many beams are diffracted at that particular wavelength, as well as the spectral resolution. A diffraction order of 0 means the incident light angle and the diffracted angle are roughly the same while a diffraction order of 1 is twice the incident wavelength. Wider groove spacing means fewer orders of diffraction, resulting in higher the light throughput. Aside from using a grating with large groove spacings, filters are commonly used to remove any higher orders of diffraction from the grating. Light diffracted from the grating is refocused by another mirror onto the exit slit which is adjusted to accommodate for the dispersive properties of different wavelengths of light.
Bandwidth
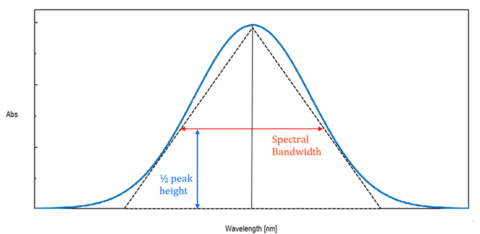
While the monochromator is set to a specific wavelength, the light emerging is not perfectly monochromatic, but contains a range of wavelengths. As seen in figure 4, the total energy at the exit slit of the monochromator at a specific wavelength has the intensity distribution of an isosceles triangle. The peak of this triangle is the target wavelength and the spectral bandwidth is the full width half max (FWHM) of the triangle. The bandwidth should be set to 1/10 of the sample peak’s FWHM.
The spectral bandwidth is directly related to the slit widths of the instrument and the relationship between the slit width (Δx) and the bandwidth (Δλ) is expressed by the following formula
∆λ=(d∙cosβ)/(n∙f) ∆x
where d is the groove spacing of diffraction grating, β is the diffraction angle, n is the diffraction order, and f is the focal length. When comparing instrument performance, it’s more appropriate to discuss spectral bandwidth rather than the slit width since the spectral bandwidth accounts for the grating resolution and differences between different types of gratings.
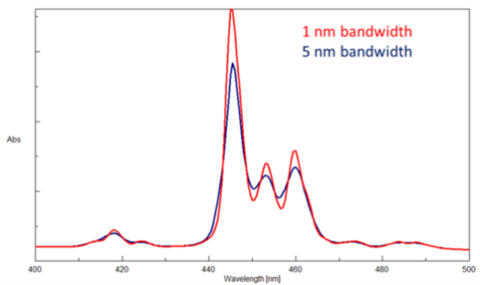
To differentiate peaks in a spectrum, the bandwidths and therefore the slit widths, need to be adjusted. The instrument’s ability to separate light into defined wavelength regions is known as spectral resolution. The narrower the bandwidth and therefore the slits, the better the resolution. However, since less light will pass through narrower slits, the spectrum will have more noise. Likewise, wider slits and bandwidths increase the light throughput and therefore the signal, but produce poorer peak resolution. The goal is to find a balance between the required resolution and the desired signal to noise. Figure 5 illustrates the measured absorption spectra using bandwidths of 1 and 5 nm. As the bandwidth increases, the peaks collapse and broaden.
It is also important to note that different bandwidths should and can be specified depending on the wavelength region being probed. The near infrared region has less light throughput than the visible region, so the bandwidth can be set to a larger value in the NIR to allow for more light to reach the sample.
UV-Visible Spectrophotometer Detectors
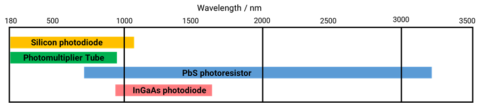
Detectors are used to measure the transmitted or reflected light from a sample and convert it into a signal. The type and material of the detector will determine the sensitivity and wavelength range of the data that can be acquired. While photomultiplier tubes and silicon photodiodes are sensitive in the ultraviolet and visible wavelength ranges, Lead sulfide (PbS) photoconductive cells and indium gallium arsenide (InGaAs) photodiodes are used to measure the near-infrared region of the spectrum. However, all the detectors mentioned below exploit the photoelectric effect where light or photons that are incident on a material result in the emission of electrons.
In a photomultiplier tube (PMT) detector, photons are incident on the photocathode surface which produces electrons. The initial electrons travel through the tube where they hit a series of plates or dynodes that amplify the number of electrons for every dynode that’s hit via secondary emission. The multiplied secondary electrons are collected at the anode, sent to an external circuit, and converted to the output signal. PMTs have a wide spectral response, high signal to noise output, and high stability.

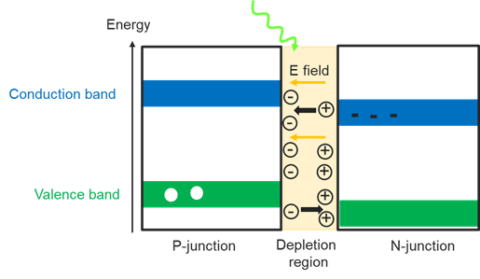
A silicon photodiode is a semiconductor device that exploits the photoelectric effect to convert light into an electrical current. When the incident photons’ energy is larger than the bandgap of silicon, the photons are absorbed and the electrons in the valence band are excited to the conduction band, creating holes in the initial valence band. The photodiode is made up of a p- and a n- junction and a depletion region. An applied electric field in this depletion region pushes the positive holes towards the n-junction while the negative electrons move towards the p-junction, building up areas of highly positive and negative charges and thus producing a photocurrent. Photodiodes have a quick response time, a slightly broader spectral range than a PMT, and low noise. While silicon photodiodes are less sensitive than PMT detectors in the UV and visible regions, they are a cheaper alternative for applications not requiring high sensitivity.
JASCO spectrophotometers use two detectors for the NIR region: a PbS detector and an InGaAs detector. While the InGaAs detector is a photodiode, the lead sulfide detector is a photoconductive cell that operates similarly to a photodiode. However, unlike photodiodes, in a photoconductive cell, the resistance decreases as the incident light intensity increases and the measured output is linearly proportional to the input incident light power.
Figure 9 shows the D* values for different detectors as a function of wavelength. The higher the D*, the better the sensitivity of the detector. The InGaAs detector shown in blue is more sensitive than the PbS detector (green) but has a shorter wavelength range. While there are other InGaAs detector options (orange) with extended wavelength ranges, the sensitivity of those is even less than the PbS detector option.
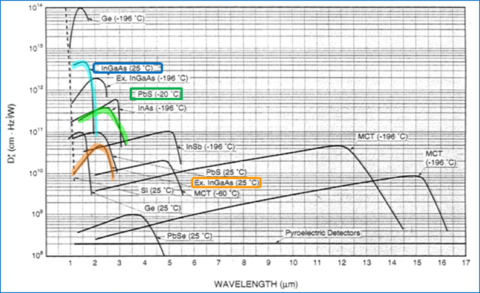
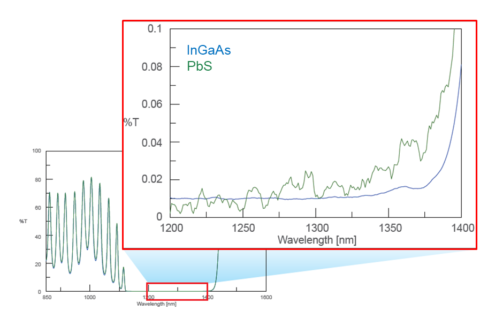
Figure 10 illustrates the difference in signal to noise between the two NIR detectors. The more sensitive InGaAs detector (blue) shows higher S/N than the PbS detector (green). Ultimately deciding between the two comes down to the application and prioritizing sensitivity, wavelength range, and cost.
Stray Light and Photometric Linearity
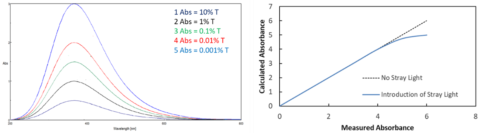
Stray light is any light that does not fall under the Gaussian distribution at a specific wavelength. Since UV-Visible spectrometers measure the ratio of the incident light to the transmitted light, any light that does not ‘reach’ the detector is considered absorbed by the sample since the instrument detector cannot differentiate between absorbed and stray light. As shown in Figure 11 on the left, at higher sample concentrations when more light is absorbed, consequently less light is transmitted. The introduction of stray light causes the measured absorbance at low transmission to deviate from the Beer-Lambert Law, contributing to inaccurate photometric values that are lower than the calculated or true absorbance (Figure 11, right).
Double-monochromator instruments are used to combat the effects of stray light. While single monochromator instruments have a single set of slits and one grating, double monochromator instruments have two gratings, two sets of slits, and additional mirrors. The extra optical components reduce the effects of stray light in the sample spectrum, decreasing the noise and allowing highly absorbing or scattering samples to be adequately measured.
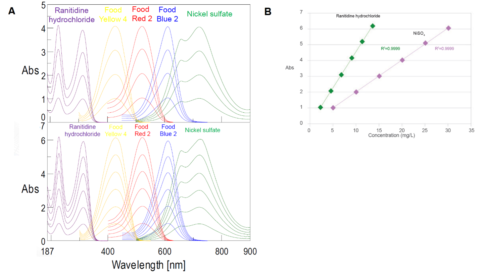
The range of absorbances that can be accurately measured before deviating from true sample absorbance is known as the instrument’s photometric linearity and is directed affected by stray light and therefore the monochromator’s optics. Since the absorbance is directly proportional to sample concentration, the larger the photometric range, the great the sample concentration can be measured. Figure 12A illustrates the absorbance spectra for a single- (top) and double- (bottom) monochromator instruments. Both instruments have a wide photometric range that span the entire wavelength range of the instrument. However, in the double monochromator, the photometric range is roughly 2 absorbance units greater than the single monochromator instrument. The linearity of the double-monochromator is shown in Figure 12B, where the absorbance is plotted as a function of sample concentration for nickel (II) sulfate and ranitidine hydrochloride.