An evaluation of physico-chemical properties of the mobile phase in Supercritical Fluid Chromatography when using sub-2µm particle columns
August 22, 2022
Introduction
In Supercritical Fluid Chromatography (SFC), high speed analysis can be performed easily because the diffusion coefficient of the mobile phase is very high and the viscosity is low.
Recently, the use of columns packed with sub-2µm particles has become popular to perform high speed analysis without sacrificing the column efficiency in HPLC, often referred to as Ultra High-Performance Liquid Chromatography (UHPLC). If a column packed with sub-2µm particles is used in SFC, Ultra High-Performance Supercritical Fluid Chromatography (UHPSFC) could be performed.
However, in SFC, it is generally believed that the use of a low permeability column such as those packed with sub-2µm particles results in poor column efficiency due to a large pressure drop across the column creating a negative density gradient along the length of the column. This may be true if the actual elution conditions are in a supercritical state and close to the critical point.
Generally, a mixture of CO2 and an organic modifier co-solvent, typically an alcohol is used as the mobile phase in SFC. The critical temperature and pressure for such a mixture is generally much higher than that for pure CO2, and the typical mobile phase used in ‘real world’ SFC is often not in a supercritical state. Therefore, we have investigated the effect of several parameters such as temperature and pressure for the commonly used mobile phase mixture of CO2 and methanol and the impact on the H-u curve in UHPSFC.
We first discuss from a theoretical point of view and then evaluate the experimental results by comparing them to the theoretical data. In addition, we evaluated high speed separation of fat-soluble vitamins by UHPSFC.
Physical Properties of CO2 and Methanol System and Vapor-liquid equilibria for CO2 and methanol system:
It is important to know the physical properties of the CO2 and methanol mixture system that is used as a mobile phase.
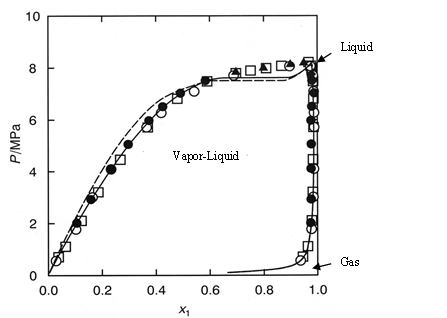
Figure 1 shows the experimental vapor-liquid equilibria data of CO2 and methanol mixture system at a temperature of 40 ºC by Kodama et al1). The area enclosed by the measured data points shows the area that the mixture exists as two phases; vapor and liquid. The outside area shows the area that the mixture exists as one phase; liquid or gas or supercritical fluid.
Generally, in SFC a back pressure of 10MPa or higher is applied to the column. At these pressures we can safely say that the mixture system is single phase.
Calculation of critical temperature and pressure of a mixture of CO2 and methanol
The critical temperature and pressure of a mixture of CO2 and methanol can be calculated from the equations proposed by Cheuh and Prausnitz2). Saito and Nitta3) wrote a convenient computer program for the calculation of various mixtures containing CO2 and organic solvents and compared the results with experimental data. The Kij value was determined to be 0.2 according to the value proposed by Brunner4).
The coefficients, A, B, C, D, and E used in the calculation were obtained from the reference5); -0.0076, 0.287, -1.343, 5.443, and -3.038 respectively. The authors used the computer program to calculate the critical parameters.
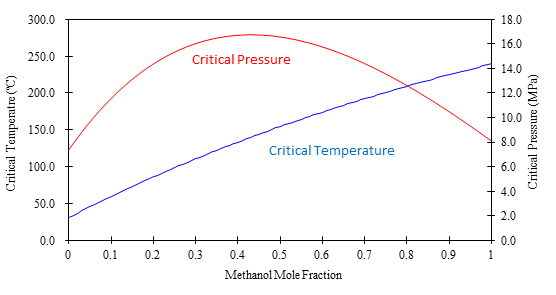
Figure 2 shows a graph of the calculated critical temperature and pressure against the methanol mole fraction. As shown in this figure, the critical temperature elevates as the methanol mole fraction increases, while the critical pressure exhibits a maximum value at the mole fraction of approximately 0.45.
Table 1 lists several volumetric ratios (90:10, 80:20, 70:30 and 50:50) of CO2 and methanol and corresponding methanol mole fractions, critical temperatures and pressures for the readers’ convenience. Even with a ratio of CO2 and methanol at 50:50 (considered a modifier rich condition, but often used in SFC) the critical pressure is about 16MPa which is not an unusual pressure. However, the critical temperature is 124ºC, which is outside of the normal temperature range used in SFC (a temperature lower than 60ºC is generally used). Under these conditions, the mixture mobile phase is in the liquid or subcritical state.
| CO2 Volume Ratio | Methanol Volume Ratio | Methanol Mole Fraction | Critical Temperature (°C) | Critical Pressure (MPa) |
|---|---|---|---|---|
| 90 | 10 | 0.07 | 51.13 | 10.46 |
| 80 | 20 | 0.12 | 64.91 | 12.22 |
| 70 | 30 | 0.20 | 85.92 | 14.37 |
| 50 | 50 | 0.36 | 124.37 | 16.54 |
Calculation of density of a mixture of CO2 and methanol
The density in CO2 and methanol mixture system can be calculated using the Pseudo cubic perturbed hard-sphere (PPHS) equations proposed by Kato et al6). The authors were permitted by Dr. Kato to use his computer program to calculate the density of a mixture of CO2 and methanol at methanol mole fraction of 0.07. The Kij and lij values have not been measured. Therefore, we assumed these parameters to be zero.
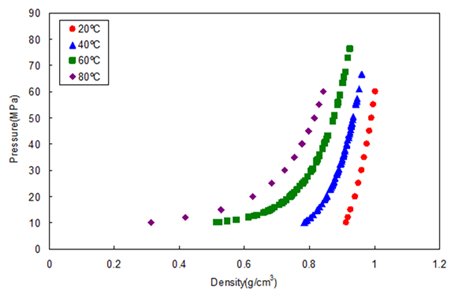
Figure 3 shows the relationship between the density and pressure calculated by the above method. As the pressure becomes higher, the density rapidly increases. This behavior is more significant when the fluid temperature is higher. This shows that the mobile phase state is transferred from gas to supercritical region when the pressure is increased at a higher temperature.
In other words, the chromatographer is changing the chromatographic conditions without knowing from liquid to supercritical to gas chromatography by changing the temperature while the pressure is maintained higher than the mixture critical pressure.
Experimental
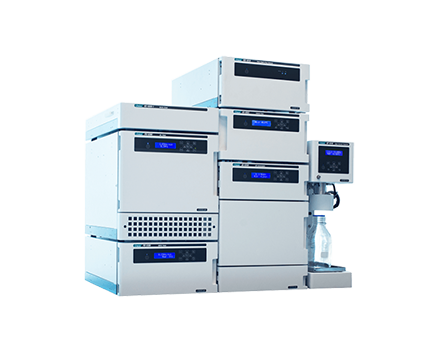
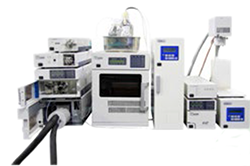
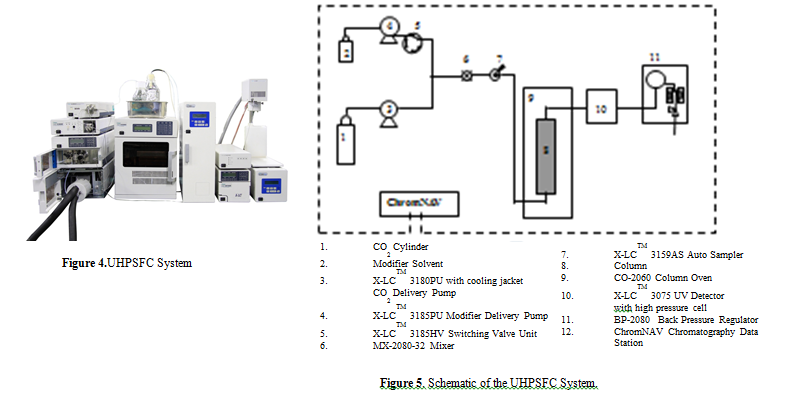
Figure 4 Typical JASCO UHPSFC systems.
Figure 5 shows the flow diagram of the system.
A column, ZORBAX RX-SIL, 1.8µm, 2.1 mm ID x 100 mmL and 3.0 mm ID x 100 mmL was purchased from Agilent Technologies, USA.
Carbon dioxide (99.98 %) was supplied by TOYOKO KAGAKU Co., Ltd, Kanagawa, Japan. HPLC-grade methanol used as a modifier solvent; Caffeine, Toluene, and Ergocalciferol (Vitamin D2) were purchased from Wako Pure Chemicals, Osaka, Japan. a, b, d-tocopherol (Vitamin E) were purchased from Eisai, Tokyo, Japan.
Results
Van Deemter Equation
The Van Deemter equation is generally used to evaluate the efficiency of the column. The equation is often expressed in a simplified form as equation (1). In SFC, DM is often more than 10 times higher than that for liquid solvents. Therefore, the Hmin value can be obtained at a higher u value, offering a higher speed of analysis than that in HPLC.
However, slow mass transfer, still remains within the stationary phase which restricts the efficiency and the speed of the analysis. Thus, a smaller particle size and thinner stationary phase film thickness is preferable. Figure 6 illustrates the contribution of each term in Equation (1) to H and u.
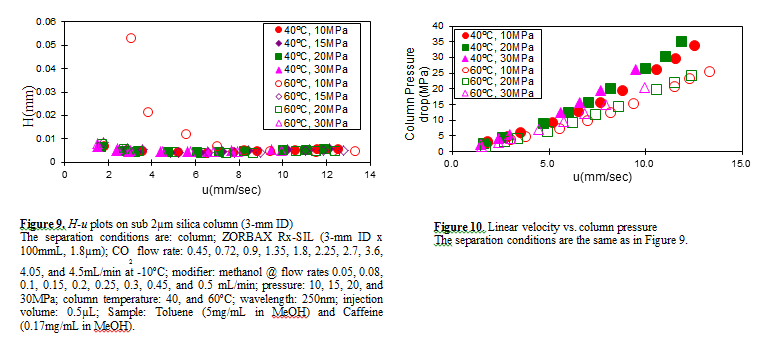
In our experiment, the efficiency of a column packed with sub-2µm particles was measured. H was calculated from the peak of caffeine and u was calculated by using the retention time of toluene as t0.
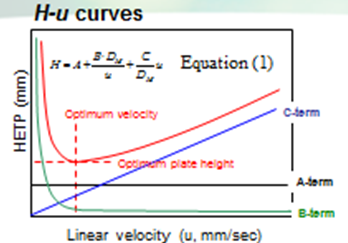
Figure 7 shows the measured H-u plots for a 2-mm ID column. Unless otherwise noted, the pressures shown in all figures are column outlet pressures applied by the back-pressure regulator. As shown in this figure, H increases in the range of lower linear velocities only when the temperature and pressure is at 60ºC and 10MPa, respectively.
Under these conditions, the density is calculated to be 0.5g/cm3 from the PPHS equations, and the chromatography behaves like gas chromatography or traditional supercritical fluid chromatography (pure CO2 mobile phase at relatively high temperatures); H increases at lower u caused by higher longitudinal diffusion of the sample solute in the mobile phase.
When the density is increased to 0.7g/cm3 or more by elevating the pressure or lowering the temperature, the behavior tends towards liquid chromatography because the solvating power depends on the density. It should be noted that density depends not only on the pressure but also on the temperature.
Figure 8 shows the column pressure drop exhibited in the experiment of H-u plots discussed above. As shown in the figure, when the temperature is high, the column pressure drop is low because both the viscosity and density are low.
H-u plots dependence on temperature
Figure 11 shows the H-u plot depending on temperature. As the temperature was increased, the optimum velocity shifts to the higher velocity region, and H itself becomes smaller. That is because as the temperature increases, the viscosity decreases.
Under the conditions of 60ºC and 20MPa, which gave a column pressure drop of ca. 10MPa, the minimum plate height was about 4µm, which is very close to the theoretical minimum value, proving that the overall chromatographic system is performing extremely efficiently.

H-u Curve dependence on column ID
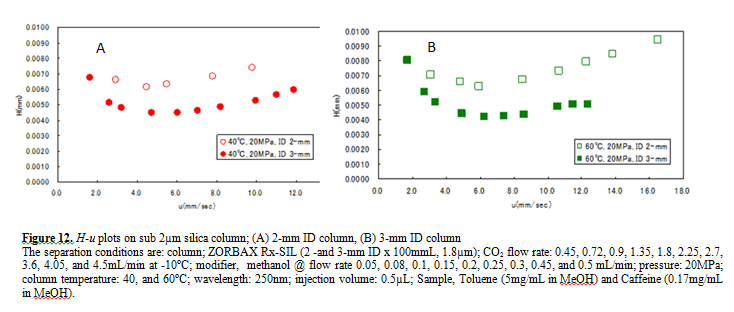
Figure 12 A and B compare the H-u plots for the 2-mm and 3-mm ID columns. The optimum velocities were 6mm/sec for both columns. With this velocity the column pressure drop was ca. 10MPa for both columns. However, the 3-mm ID column offers lower H than the 2-mm ID column at both 40 and 60ºC temperatures.
This result shows that the column pressure drop did not affect H. However, smaller peak volumes generated by the 2-mm ID column could contribute more significantly to extra-column band broadening, resulting in higher H. In any case, it is remarkable that the 3-mm ID column offered the H as low as 4µm that is very close to the theoretical minimum value.
Separation of Fat-soluble Vitamins
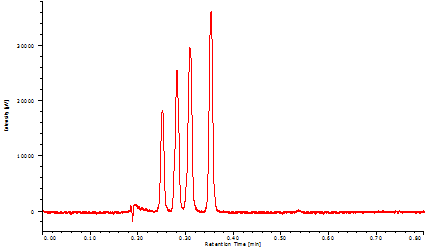
In order to demonstrate the high performance of the system, which we discussed above, we separated fat-soluble vitamins using the 3-mm ID column packed with sub-2µm particles.
Figure 13 successfully shows that four vitamins were separated within only 24 seconds with baseline separation.
Conclusion
- Today’s normal SFC conditions with CO2 containing a relatively high- concentration of organic modifier are often in the liquid or subcritical state.
- Contrary to the legacy of SFC theory, these conditions do not deteriorate the column efficiency of sub-2µm particle columns which give a high column pressure drop.
- The SFC chromatographer today is often changing the chromatographic conditions without knowing from liquid to supercritical to gas chromatography by changing the temperature while the pressure is kept higher than the mixture critical pressure.
- It is very important for SFC chromatographers to know the critical parameters of a mobile phase mixture in order to control the elution behavior.
- Four fat-soluble vitamins were separated within only 24 sec.
References
- D. Kodama, N. Kubota, Y. Yamaki, H. Tanaka, M. Kato, Netsu Bussei, 10, 16-20 (1996)
- P. L. Cheuh and J. M. Prausnitz, AIChE J. 13, 1107 (1967)
- E. Brunner, J. Chem. Thermodyn. 17, 671 (1985)
- M. Saito, T. Nitta in M. Saito, Y. Yamauchi and T. Okuyama eds: “Fractionation by Packed-Column SFC and SFE”, VCH Publishers, Inc. Chapter 2 (1994), New York.
- C. C. Li, Can. J. Chem. Eng. 19, 709 (1971)
- M. Kato, M, Yamaguchi, T. Kiuchi, Fluid Phase Equilibria, 47, 171-187 (1989)
Featured Products:

An evaluation of physico-chemical properties of the mobile phase in Supercritical Fluid Chromatography when using sub-2µm particle columns
Introduction
In Supercritical Fluid Chromatography (SFC), high speed analysis can be performed easily because the diffusion coefficient of the mobile phase is very high and the viscosity is low.
Recently, the use of columns packed with sub-2µm particles has become popular to perform high speed analysis without sacrificing the column efficiency in HPLC, often referred to as Ultra High-Performance Liquid Chromatography (UHPLC). If a column packed with sub-2µm particles is used in SFC, Ultra High-Performance Supercritical Fluid Chromatography (UHPSFC) could be performed.

However, in SFC, it is generally believed that the use of a low permeability column such as those packed with sub-2µm particles results in poor column efficiency due to a large pressure drop across the column creating a negative density gradient along the length of the column. This may be true if the actual elution conditions are in a supercritical state and close to the critical point.
Generally, a mixture of CO2 and an organic modifier co-solvent, typically an alcohol is used as the mobile phase in SFC. The critical temperature and pressure for such a mixture is generally much higher than that for pure CO2, and the typical mobile phase used in ‘real world’ SFC is often not in a supercritical state. Therefore, we have investigated the effect of several parameters such as temperature and pressure for the commonly used mobile phase mixture of CO2 and methanol and the impact on the H-u curve in UHPSFC.
We first discuss from a theoretical point of view and then evaluate the experimental results by comparing them to the theoretical data. In addition, we evaluated high speed separation of fat-soluble vitamins by UHPSFC.
Physical Properties of CO2 and Methanol System and Vapor-liquid equilibria for CO2 and methanol system:
It is important to know the physical properties of the CO2 and methanol mixture system that is used as a mobile phase.
Figure 1 shows the experimental vapor-liquid equilibria data of CO2 and methanol mixture system at a temperature of 40 ºC by Kodama et al1). The area enclosed by the measured data points shows the area that the mixture exists as two phases; vapor and liquid. The outside area shows the area that the mixture exists as one phase; liquid or gas or supercritical fluid.
Generally, in SFC a back pressure of 10MPa or higher is applied to the column. At these pressures we can safely say that the mixture system is single phase.

Calculation of critical temperature and pressure of a mixture of CO2 and methanol
The critical temperature and pressure of a mixture of CO2 and methanol can be calculated from the equations proposed by Cheuh and Prausnitz2). Saito and Nitta3) wrote a convenient computer program for the calculation of various mixtures containing CO2 and organic solvents and compared the results with experimental data. The Kij value was determined to be 0.2 according to the value proposed by Brunner4).
The coefficients, A, B, C, D, and E used in the calculation were obtained from the reference5); -0.0076, 0.287, -1.343, 5.443, and -3.038 respectively. The authors used the computer program to calculate the critical parameters.
Figure 2 shows a graph of the calculated critical temperature and pressure against the methanol mole fraction. As shown in this figure, the critical temperature elevates as the methanol mole fraction increases, while the critical pressure exhibits a maximum value at the mole fraction of approximately 0.45.
Table 1 lists several volumetric ratios (90:10, 80:20, 70:30 and 50:50) of CO2 and methanol and corresponding methanol mole fractions, critical temperatures and pressures for the readers’ convenience. Even with a ratio of CO2 and methanol at 50:50 (considered a modifier rich condition, but often used in SFC) the critical pressure is about 16MPa which is not an unusual pressure. However, the critical temperature is 124ºC, which is outside of the normal temperature range used in SFC (a temperature lower than 60ºC is generally used). Under these conditions, the mixture mobile phase is in the liquid or subcritical state.
| CO2 Volume Ratio | Methanol Volume Ratio | Methanol Mole Fraction | Critical Temperature (°C) | Critical Pressure (MPa) |
|---|---|---|---|---|
| 90 | 10 | 0.07 | 51.13 | 10.46 |
| 80 | 20 | 0.12 | 64.91 | 12.22 |
| 70 | 30 | 0.20 | 85.92 | 14.37 |
| 50 | 50 | 0.36 | 124.37 | 16.54 |

Calculation of density of a mixture of CO2 and methanol
The density in CO2 and methanol mixture system can be calculated using the Pseudo cubic perturbed hard-sphere (PPHS) equations proposed by Kato et al6). The authors were permitted by Dr. Kato to use his computer program to calculate the density of a mixture of CO2 and methanol at methanol mole fraction of 0.07. The Kij and lij values have not been measured. Therefore, we assumed these parameters to be zero.
Figure 3 shows the relationship between the density and pressure calculated by the above method. As the pressure becomes higher, the density rapidly increases. This behavior is more significant when the fluid temperature is higher. This shows that the mobile phase state is transferred from gas to supercritical region when the pressure is increased at a higher temperature.
In other words, the chromatographer is changing the chromatographic conditions without knowing from liquid to supercritical to gas chromatography by changing the temperature while the pressure is maintained higher than the mixture critical pressure.

Experimental
Figure 4 Typical JASCO UHPSFC systems.
Figure 5 shows the flow diagram of the system.

A column, ZORBAX RX-SIL, 1.8µm, 2.1 mm ID x 100 mmL and 3.0 mm ID x 100 mmL was purchased from Agilent Technologies, USA.
Carbon dioxide (99.98 %) was supplied by TOYOKO KAGAKU Co., Ltd, Kanagawa, Japan. HPLC-grade methanol used as a modifier solvent; Caffeine, Toluene, and Ergocalciferol (Vitamin D2) were purchased from Wako Pure Chemicals, Osaka, Japan. a, b, d-tocopherol (Vitamin E) were purchased from Eisai, Tokyo, Japan.
Results
Van Deemter Equation
The Van Deemter equation is generally used to evaluate the efficiency of the column. The equation is often expressed in a simplified form as equation (1). In SFC, DM is often more than 10 times higher than that for liquid solvents. Therefore, the Hmin value can be obtained at a higher u value, offering a higher speed of analysis than that in HPLC.
However, slow mass transfer, still remains within the stationary phase which restricts the efficiency and the speed of the analysis. Thus, a smaller particle size and thinner stationary phase film thickness is preferable. Figure 6 illustrates the contribution of each term in Equation (1) to H and u.
In our experiment, the efficiency of a column packed with sub-2µm particles was measured. H was calculated from the peak of caffeine and u was calculated by using the retention time of toluene as t0.

Figure 7 shows the measured H-u plots for a 2-mm ID column. Unless otherwise noted, the pressures shown in all figures are column outlet pressures applied by the back-pressure regulator. As shown in this figure, H increases in the range of lower linear velocities only when the temperature and pressure is at 60ºC and 10MPa, respectively.
Under these conditions, the density is calculated to be 0.5g/cm3 from the PPHS equations, and the chromatography behaves like gas chromatography or traditional supercritical fluid chromatography (pure CO2 mobile phase at relatively high temperatures); H increases at lower u caused by higher longitudinal diffusion of the sample solute in the mobile phase.
When the density is increased to 0.7g/cm3 or more by elevating the pressure or lowering the temperature, the behavior tends towards liquid chromatography because the solvating power depends on the density. It should be noted that density depends not only on the pressure but also on the temperature.
Figure 8 shows the column pressure drop exhibited in the experiment of H-u plots discussed above. As shown in the figure, when the temperature is high, the column pressure drop is low because both the viscosity and density are low.

H-u plots dependence on temperature
Figure 11 shows the H-u plot depending on temperature. As the temperature was increased, the optimum velocity shifts to the higher velocity region, and H itself becomes smaller. That is because as the temperature increases, the viscosity decreases.
Under the conditions of 60ºC and 20MPa, which gave a column pressure drop of ca. 10MPa, the minimum plate height was about 4µm, which is very close to the theoretical minimum value, proving that the overall chromatographic system is performing extremely efficiently.

H-u Curve dependence on column ID
Figure 12 A and B compare the H-u plots for the 2-mm and 3-mm ID columns. The optimum velocities were 6mm/sec for both columns. With this velocity the column pressure drop was ca. 10MPa for both columns. However, the 3-mm ID column offers lower H than the 2-mm ID column at both 40 and 60ºC temperatures.
This result shows that the column pressure drop did not affect H. However, smaller peak volumes generated by the 2-mm ID column could contribute more significantly to extra-column band broadening, resulting in higher H. In any case, it is remarkable that the 3-mm ID column offered the H as low as 4µm that is very close to the theoretical minimum value.

Separation of Fat-soluble Vitamins
In order to demonstrate the high performance of the system, which we discussed above, we separated fat-soluble vitamins using the 3-mm ID column packed with sub-2µm particles.
Figure 13 successfully shows that four vitamins were separated within only 24 seconds with baseline separation.

Conclusion
- Today’s normal SFC conditions with CO2 containing a relatively high- concentration of organic modifier are often in the liquid or subcritical state.
- Contrary to the legacy of SFC theory, these conditions do not deteriorate the column efficiency of sub-2µm particle columns which give a high column pressure drop.
- The SFC chromatographer today is often changing the chromatographic conditions without knowing from liquid to supercritical to gas chromatography by changing the temperature while the pressure is kept higher than the mixture critical pressure.
- It is very important for SFC chromatographers to know the critical parameters of a mobile phase mixture in order to control the elution behavior.
- Four fat-soluble vitamins were separated within only 24 sec.
References
- D. Kodama, N. Kubota, Y. Yamaki, H. Tanaka, M. Kato, Netsu Bussei, 10, 16-20 (1996)
- P. L. Cheuh and J. M. Prausnitz, AIChE J. 13, 1107 (1967)
- E. Brunner, J. Chem. Thermodyn. 17, 671 (1985)
- M. Saito, T. Nitta in M. Saito, Y. Yamauchi and T. Okuyama eds: “Fractionation by Packed-Column SFC and SFE”, VCH Publishers, Inc. Chapter 2 (1994), New York.
- C. C. Li, Can. J. Chem. Eng. 19, 709 (1971)
- M. Kato, M, Yamaguchi, T. Kiuchi, Fluid Phase Equilibria, 47, 171-187 (1989)

 Download This Application