High Sensitivity Coumarin Analysis
January 8, 2024
 Download This Application
Introduction
To prevent the production of illegal light diesel oil, which contains kerosene or heavy oil, 1 ppm of coumarin is added to either the kerosene or a heavy oil as a discriminator. The analysis procedure for determining the discriminator and its mixing concentration is standardized by the National Petroleum Dealers Association and uses a spectrofluorometer to determine concentration.
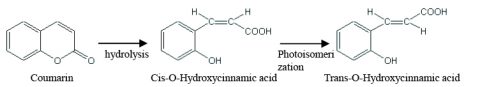
Coumarin is hydrolyzed in alkaline solution and becomes cis-O-hydroxycinnamic acid. The cis-O-hydroxycinnamic acid is then isomerized by ultraviolet radiation and converted to trans-O- hydroxycinnamic acid. Since trans-O- hydroxycinnamic acid fluoresces, the product can be quantified using fluorescence spectroscopy.
While the current procedure is relatively simple, the purpose is to determine the coumarin concentration within more than a couple percent of the related oils. This application note introduces a high sensitivity system to improve the concentration detection limit to less than 1 percent and reduce the quantitation limit.
Experimental
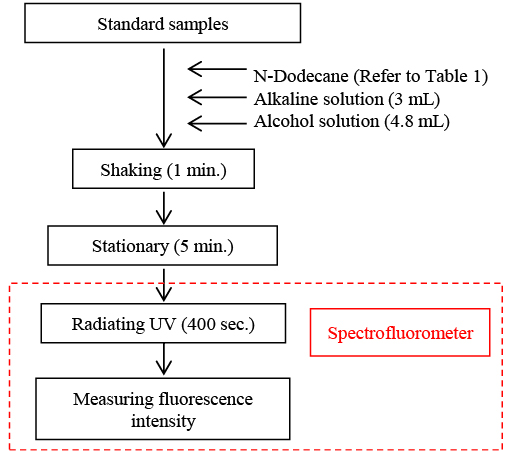
1000 ppm of undiluted coumarin solution was made by dissolving 100 mg of coumarin in an aromatic solvent such as n-propyl benzene. The standard coumarin samples were prepared by diluting 100 µL of the undiluted coumarin solution using 1 ppm of n-dodecane and further diluting the solution to 0.1 ppm. For the alkaline solution reagent, 10 g of sodium hydroxide and 20 g of sodium nitrate were dissolved in 100 mL of Millipore water and kept in a polyethylene vessel. 40 mL of 1-butanol and 30 mL of ethanol were mixed for the alcohol solution. The standard samples were then mixed in test tubes, according to the specified ratios in Table 1. Following the procedure in Figure 2, the samples were shaken to hydrolyze the coumarin and then extracted in the alkaline solution. The samples were then kept stationary for 5 minutes to allow for separation of the solution layers. The photoisomerization reaction was induced by irradiating the sample using a spectrofluorometer and an excitation wavelength of 360 nm. The fluorescence intensity was detected at 500 nm and used to generate a calibration curve.
Table 1. Mixing ratios of the standard solution.
| Additive Concentration | Coumarin Solution (mL) | n-dodecane (mL) | Alkaline Solution (mL) | Alcohol Dolution (ml) |
| 0% | 0 | 4.2 | 3 | 4.8 |
| 1% | 0.06 | 4.14 | 3 | 4.8 |
| 2% | 0.12 | 4.08 | 3 | 4.8 |
| 4% | 0.24 | 3.96 | 3 | 4.8 |
| 6% | 0.36 | 3.84 | 3 | 4.8 |
| 8% | 0.48 | 3.72 | 3 | 4.8 |
| 10% | 0.96 | 3.24 | 3 | 4.8 |
Measurement Conditions
| Fluorescence | Time Course | ||
| Excitation Wavelength | 360 nm | Excitation Wavelength* | 360 nm |
| Scan Speed | 1000 nm/min | Emission Wavelength | 500 nm |
| Excitation Bandwidth | 10 nm | Excitation Bandwidth | 20 nm |
| Emission Bandwidth | 10 nm | Emission Bandwidth | 10 nm |
| Data Interval | 1 nm | Data Interval | 2 sec |
| Response Time | Fast | Response Time | 2 sec |
| Sensitivity | High | Sensitivity | High |
| Scan Speed | 500 nm/min | ||
*The excitation was set at 20 nm to perform photoisomerization effectively for the Time course measurement. Excitation bandwidth was set at 10 nm for the Spectrum measurement in order to suppress reduction of fluorescence intensity due to photolysis.
Keywords
050-FP-0029B, FP-6300, Fluorescence, Coumarin, kerosene, diesel, O-hydroxycinnamic acid
Results
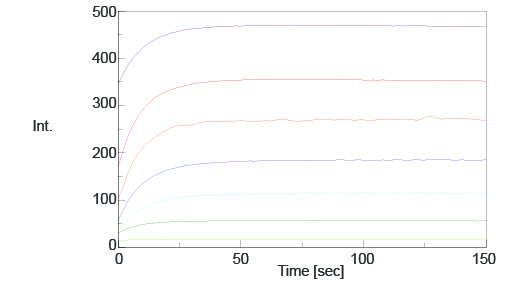
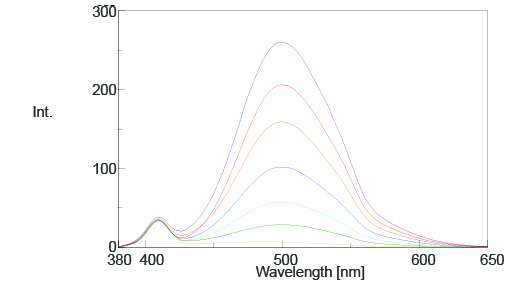
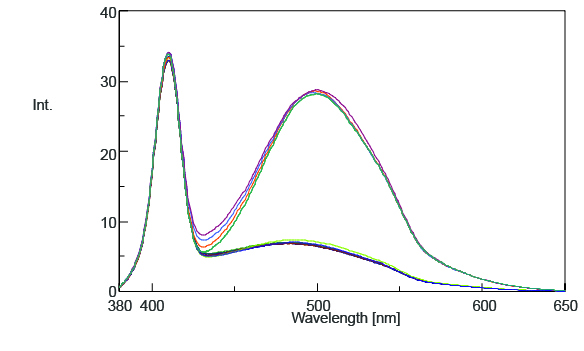
The time course and spectral measurement data of the standard samples with varying additive concentrations are shown in Figures 2 and 3. Both figures indicate an increase in fluorescence intensity with increasing additive concentration and Figure 2 shows that the photoisomerization reaction is finished in 150 seconds after exposing the samples to UV radiation.
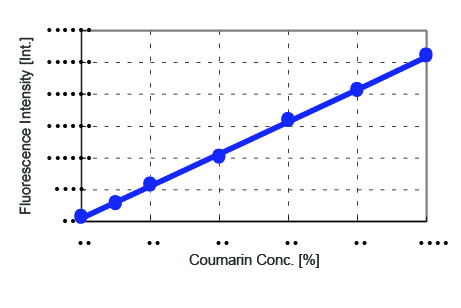
A calibration curve plotting the fluorescence intensity at 500 nm as a function of the additive coumarin concentration is shown in Figure 4 and the corresponding values in Table 2. The correlation coefficient obtained for the calibration curve was 0.9993, indicating good linearity.
Table 2. The additive coumarin concentrations with their corresponding fluorescence intensities at 500 nm.
| Additive Concentration | Fluorescence Intensity (at 500 nm) |
| 0% | 6.7077 |
| 1% | 28.7548 |
| 2% | 57.3873 |
| 4% | 101.829 |
| 6% | 158.903 |
| 8% | 205.882 |
| 10% | 260.236 |
The fluorescence measurements of 0% and 1% standard solution concentrations were repeated 5 times and are shown in Figure 5. The standard deviation for the fluorescence intensity was 0.4357 while the coumarin concentration was 0.0172.
Conclusion
These results demonstrate that it is possible to use the high sensitivity spectrofluorometer system to analysis diesel oil discriminators with a 0.06% detection limit and 0.2% quantitation limit*.
*Detection limit was calculated by 3 sigma and quantitation limit was calculated by 10 sigma.
Featured Products:
-
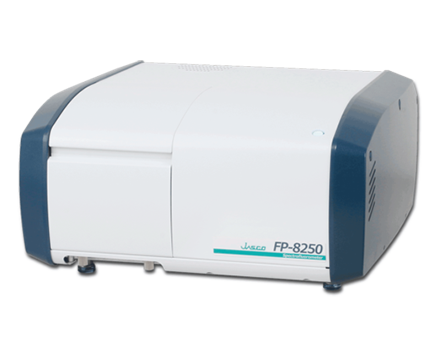
Simple and sensitive system which readily accommodates routine measurements and accessories, such as spectral scanning, quantitation, and temperature control.
FP-8250 Spectrofluorometer
-
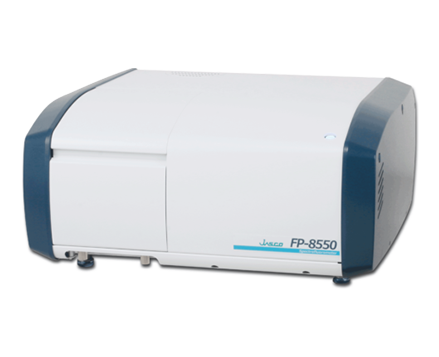
Sophisticated optical system offering the ultimate in sensitivity, spectral accuracy, and flexibility for the most challenging materials and biological samples.
FP-8550 Spectrofluorometer
-
Uniquely optimized for NIR applications with extended wavelength measurement to 1010 nm.
FP-8650 NIR Spectrofluorometer

High Sensitivity Coumarin Analysis
Introduction
To prevent the production of illegal light diesel oil, which contains kerosene or heavy oil, 1 ppm of coumarin is added to either the kerosene or a heavy oil as a discriminator. The analysis procedure for determining the discriminator and its mixing concentration is standardized by the National Petroleum Dealers Association and uses a spectrofluorometer to determine concentration.
Coumarin is hydrolyzed in alkaline solution and becomes cis-O-hydroxycinnamic acid. The cis-O-hydroxycinnamic acid is then isomerized by ultraviolet radiation and converted to trans-O- hydroxycinnamic acid. Since trans-O- hydroxycinnamic acid fluoresces, the product can be quantified using fluorescence spectroscopy.
While the current procedure is relatively simple, the purpose is to determine the coumarin concentration within more than a couple percent of the related oils. This application note introduces a high sensitivity system to improve the concentration detection limit to less than 1 percent and reduce the quantitation limit.
Experimental
1000 ppm of undiluted coumarin solution was made by dissolving 100 mg of coumarin in an aromatic solvent such as n-propyl benzene. The standard coumarin samples were prepared by diluting 100 µL of the undiluted coumarin solution using 1 ppm of n-dodecane and further diluting the solution to 0.1 ppm. For the alkaline solution reagent, 10 g of sodium hydroxide and 20 g of sodium nitrate were dissolved in 100 mL of Millipore water and kept in a polyethylene vessel. 40 mL of 1-butanol and 30 mL of ethanol were mixed for the alcohol solution. The standard samples were then mixed in test tubes, according to the specified ratios in Table 1. Following the procedure in Figure 2, the samples were shaken to hydrolyze the coumarin and then extracted in the alkaline solution. The samples were then kept stationary for 5 minutes to allow for separation of the solution layers. The photoisomerization reaction was induced by irradiating the sample using a spectrofluorometer and an excitation wavelength of 360 nm. The fluorescence intensity was detected at 500 nm and used to generate a calibration curve.
Table 1. Mixing ratios of the standard solution.
| Additive Concentration | Coumarin Solution (mL) | n-dodecane (mL) | Alkaline Solution (mL) | Alcohol Dolution (ml) |
| 0% | 0 | 4.2 | 3 | 4.8 |
| 1% | 0.06 | 4.14 | 3 | 4.8 |
| 2% | 0.12 | 4.08 | 3 | 4.8 |
| 4% | 0.24 | 3.96 | 3 | 4.8 |
| 6% | 0.36 | 3.84 | 3 | 4.8 |
| 8% | 0.48 | 3.72 | 3 | 4.8 |
| 10% | 0.96 | 3.24 | 3 | 4.8 |
Measurement Conditions
| Fluorescence | Time Course | ||
| Excitation Wavelength | 360 nm | Excitation Wavelength* | 360 nm |
| Scan Speed | 1000 nm/min | Emission Wavelength | 500 nm |
| Excitation Bandwidth | 10 nm | Excitation Bandwidth | 20 nm |
| Emission Bandwidth | 10 nm | Emission Bandwidth | 10 nm |
| Data Interval | 1 nm | Data Interval | 2 sec |
| Response Time | Fast | Response Time | 2 sec |
| Sensitivity | High | Sensitivity | High |
| Scan Speed | 500 nm/min | ||
*The excitation was set at 20 nm to perform photoisomerization effectively for the Time course measurement. Excitation bandwidth was set at 10 nm for the Spectrum measurement in order to suppress reduction of fluorescence intensity due to photolysis.
Results
The time course and spectral measurement data of the standard samples with varying additive concentrations are shown in Figures 2 and 3. Both figures indicate an increase in fluorescence intensity with increasing additive concentration and Figure 2 shows that the photoisomerization reaction is finished in 150 seconds after exposing the samples to UV radiation.
A calibration curve plotting the fluorescence intensity at 500 nm as a function of the additive coumarin concentration is shown in Figure 4 and the corresponding values in Table 2. The correlation coefficient obtained for the calibration curve was 0.9993, indicating good linearity.
Table 2. The additive coumarin concentrations with their corresponding fluorescence intensities at 500 nm.
| Additive Concentration | Fluorescence Intensity (at 500 nm) |
| 0% | 6.7077 |
| 1% | 28.7548 |
| 2% | 57.3873 |
| 4% | 101.829 |
| 6% | 158.903 |
| 8% | 205.882 |
| 10% | 260.236 |
The fluorescence measurements of 0% and 1% standard solution concentrations were repeated 5 times and are shown in Figure 5. The standard deviation for the fluorescence intensity was 0.4357 while the coumarin concentration was 0.0172.
Conclusion
These results demonstrate that it is possible to use the high sensitivity spectrofluorometer system to analysis diesel oil discriminators with a 0.06% detection limit and 0.2% quantitation limit*.
*Detection limit was calculated by 3 sigma and quantitation limit was calculated by 10 sigma.
Keywords
050-FP-0029B, FP-6300, Fluorescence, Coumarin, kerosene, diesel, O-hydroxycinnamic acid