Determination of ethanol concentration using a Raman spectrometer
January 5, 2024
 Download This Application
Introduction
 Ethanol is commonly found in a wide range of materials such as alcoholic beverages, sterilization/sanitization solvents, and fuels. Its concentration is adjusted depending on the application. For example, ethanol for hand sanitization used in medical institutions is set to 70-83 vol% so that sanitizing is effective. Recently, as a temporary measure against the novel coronavirus, the use of 60 vol% has been allowed when ethanol is difficult to obtain*1. When it is necessary to use high concentration ethanol products other than general antiseptics, they must be diluted with purified water prior to use. It is important to confirm the correct ethanol concentration for the diluted product.
An FTIR spectrometer is often used to measure the concentration*2, but in this application note, we introduce the results for the quantification of ethanol concentration with the sample in a closed vial using a Raman spectrometer.
Experimental
| Samples | |
|---|---|
| Commercial ethanol-based antiseptics | 3 |
| High concentration beverage alcohol | 1 |
| Alcohol beverages | 4 |
Measurement Conditions
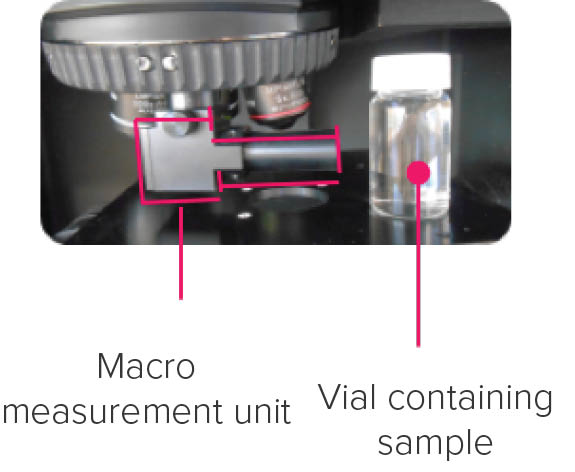
The macro measurement accessory was used for this measurement. With this unit, measurement can be made by simply placing a closed vial* containing a liquid sample in the sample chamber as shown in Figure 1. This is particularly useful for measuring highly volatile samples such as ethanol. In addition, the measurement time per sample is as short as 2 seconds, enabling quick evaluation.
* The vial must allows excitation light to pass through.
| Measurement Conditions | |
|---|---|
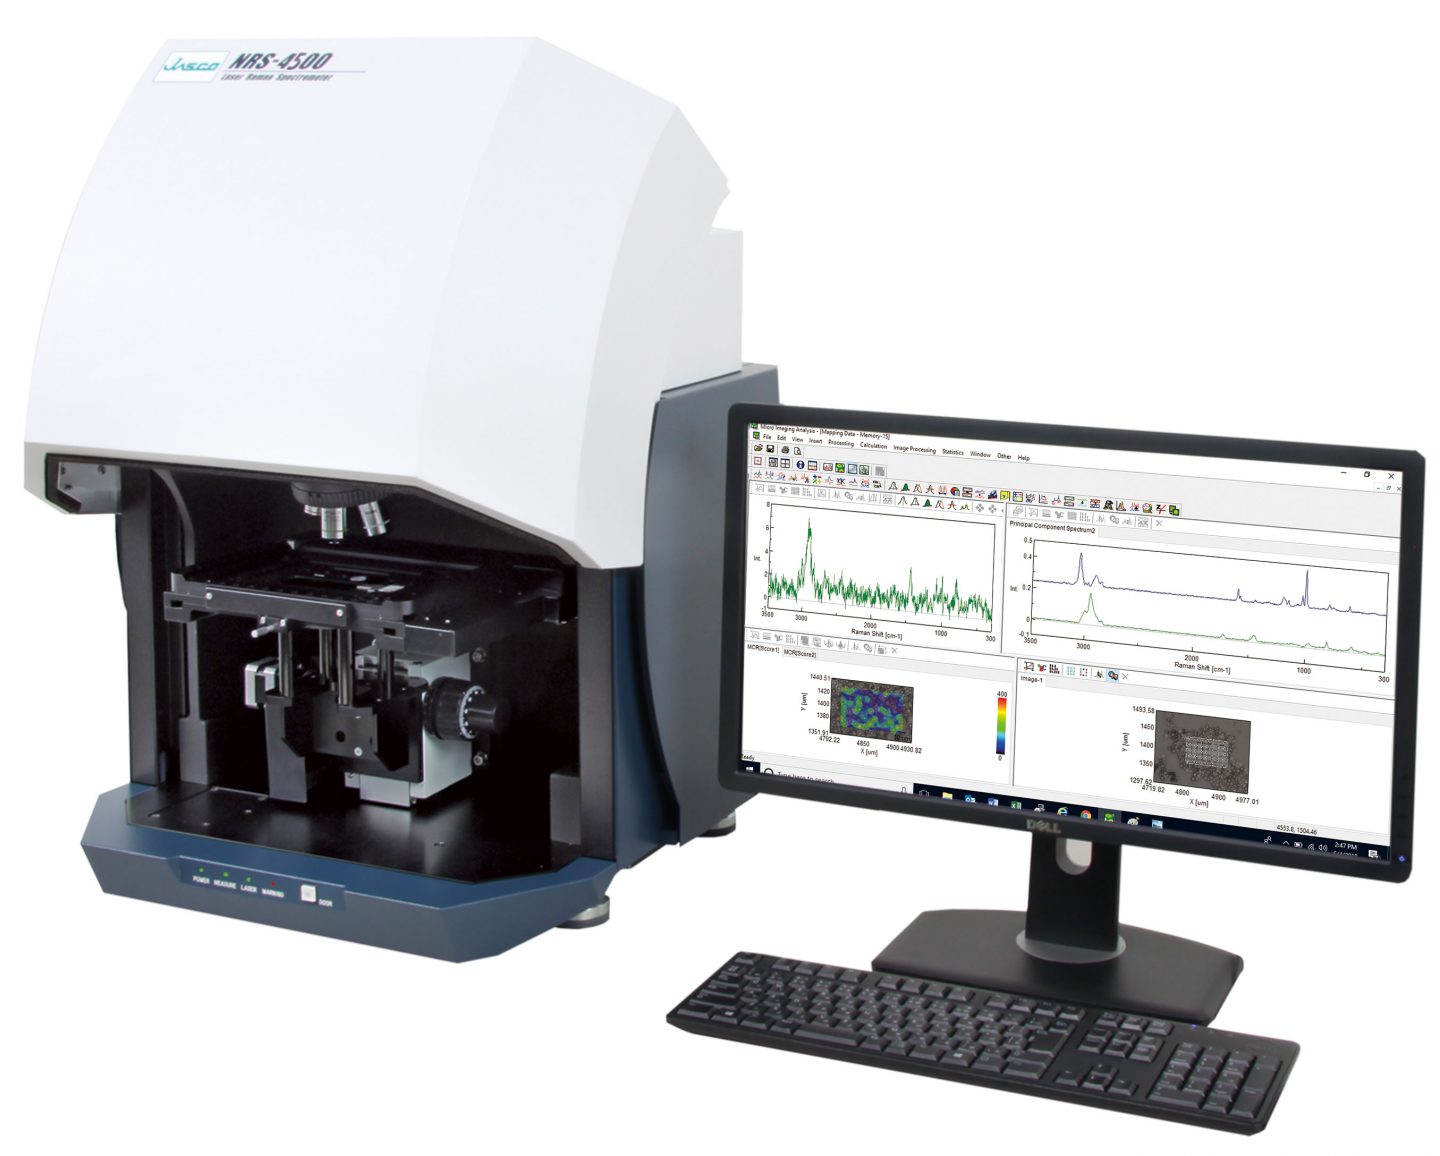
| Instruments | NRS-4500 Raman spectrometer |
| Excitation Wavelength | 532 nm |
| Exposure Time | 1 second |
| Accumulations | 2 |
Keywords
200-AN-0029, Raman spectroscopy, ethanol, quantification, macro
Results
1) Calibration curve
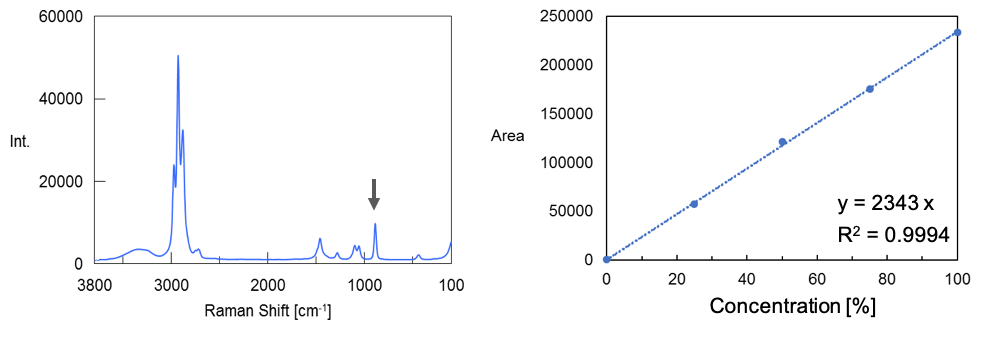
A 99.5 vol% ethanol and ultrapure water were mixed to prepare a standard sample of 0 to 99.5 vol%. A good calibration curve was obtained when it was created with the peak area near 880 cm-1 attributed to the C-C-O symmetric stretching vibration shown by the arrow in the ethanol spectrum in Figure 2.
2) Quantification result
Table 1 shows the quantitative results of the ethanol concentrations of three types of commercial antiseptics, a high concentration beverage alcohol, and four types of alcohol beverages. From high to low ethanol concentrations, it was shown to be similar to the ethanol concentrations listed on the product.
| Sample [Ethanol concentration stated (vol%)] | Ethanol quantitative results (vol%) |
|---|---|
| Ethanol-based antiseptic A (77) | 78 |
| Ethanol-based antiseptic B (75) | 77 |
| Ethanol-based antiseptic C (75) | 76 |
| High concentration beverage alcohol (66) | 64 |
| Distilled spirits [Shochu] X (35) | 35 |
| Distilled spirits [Shochu] Y (12) | 12 |
| Japanese Sake (13-14) | 14 |
| Liqueur (4) | 5 |
Conclusion
Using a Raman spectrometer, the ethanol concentration can be quickly and easily measured in samples such as antiseptics and beverage alcohol. While FTIR can be used to measure in small amounts, Raman spectrometers can be used to measure the solution in a glass or other sealed vial, minimizing the effects of volatilization.
*1 According to materials released by the Ministry of Health, Labor and Welfare, Japan
*2 FT/IR Application Note 200-AT-0266 (Quantification of Ethanol in Ethanol-based antiseptics)
| System Configuration | Model | Description | Part Number |
|---|---|---|---|
| Main Unit | NRS-4500-532 | Raman Spectrometer | 7118-J051A*3 |
| Options | RMC-457-115 | Macro measurement unit | 6882-J601A |
*3 NRS-5500/7500 can also be used.
Supplementary Information
- All samples were put in the same type of glass bottle, placed in the same position and measured.
- If the shape of the vial differs for different samples, or if an overlapping peak is present from the sample vial, it may be necessary to consider evaluation by peak ratio or multivariate analysis.
- If the sample is colored (for example, whiskey), the excitation wavelength needs to be considered to avoid fluorescence.
- In this application note the calibration curve was created using Excel.
- Differences from other instruments are as follows:
FT/IR Can be measured with a small amount of sample, but cannot be measured through a vial.
UV/Vis Spectrometer Ethanol has no absorption in the UV-Vis region and must be quantified colorimetrically.
Featured Products:

Determination of ethanol concentration using a Raman spectrometer
Introduction
Ethanol is commonly found in a wide range of materials such as alcoholic beverages, sterilization/sanitization solvents, and fuels. Its concentration is adjusted depending on the application. For example, ethanol for hand sanitization used in medical institutions is set to 70-83 vol% so that sanitizing is effective. Recently, as a temporary measure against the novel coronavirus, the use of 60 vol% has been allowed when ethanol is difficult to obtain*1. When it is necessary to use high concentration ethanol products other than general antiseptics, they must be diluted with purified water prior to use. It is important to confirm the correct ethanol concentration for the diluted product.
An FTIR spectrometer is often used to measure the concentration*2, but in this application note, we introduce the results for the quantification of ethanol concentration with the sample in a closed vial using a Raman spectrometer.
Experimental
| Samples | |
|---|---|
| Commercial ethanol-based antiseptics | 3 |
| High concentration beverage alcohol | 1 |
| Alcohol beverages | 4 |
Measurement Conditions
The macro measurement accessory was used for this measurement. With this unit, measurement can be made by simply placing a closed vial* containing a liquid sample in the sample chamber as shown in Figure 1. This is particularly useful for measuring highly volatile samples such as ethanol. In addition, the measurement time per sample is as short as 2 seconds, enabling quick evaluation.
* The vial must allows excitation light to pass through.
| Measurement Conditions | |
|---|---|
| Instruments | NRS-4500 Raman spectrometer |
| Excitation Wavelength | 532 nm |
| Exposure Time | 1 second |
| Accumulations | 2 |
Results
1) Calibration curve
A 99.5 vol% ethanol and ultrapure water were mixed to prepare a standard sample of 0 to 99.5 vol%. A good calibration curve was obtained when it was created with the peak area near 880 cm-1 attributed to the C-C-O symmetric stretching vibration shown by the arrow in the ethanol spectrum in Figure 2.
2) Quantification result
Table 1 shows the quantitative results of the ethanol concentrations of three types of commercial antiseptics, a high concentration beverage alcohol, and four types of alcohol beverages. From high to low ethanol concentrations, it was shown to be similar to the ethanol concentrations listed on the product.
| Sample [Ethanol concentration stated (vol%)] | Ethanol quantitative results (vol%) |
|---|---|
| Ethanol-based antiseptic A (77) | 78 |
| Ethanol-based antiseptic B (75) | 77 |
| Ethanol-based antiseptic C (75) | 76 |
| High concentration beverage alcohol (66) | 64 |
| Distilled spirits [Shochu] X (35) | 35 |
| Distilled spirits [Shochu] Y (12) | 12 |
| Japanese Sake (13-14) | 14 |
| Liqueur (4) | 5 |
Conclusion
Using a Raman spectrometer, the ethanol concentration can be quickly and easily measured in samples such as antiseptics and beverage alcohol. While FTIR can be used to measure in small amounts, Raman spectrometers can be used to measure the solution in a glass or other sealed vial, minimizing the effects of volatilization.
*1 According to materials released by the Ministry of Health, Labor and Welfare, Japan
*2 FT/IR Application Note 200-AT-0266 (Quantification of Ethanol in Ethanol-based antiseptics)
| System Configuration | Model | Description | Part Number |
|---|---|---|---|
| Main Unit | NRS-4500-532 | Raman Spectrometer | 7118-J051A*3 |
| Options | RMC-457-115 | Macro measurement unit | 6882-J601A |
*3 NRS-5500/7500 can also be used.
Supplementary Information
- All samples were put in the same type of glass bottle, placed in the same position and measured.
- If the shape of the vial differs for different samples, or if an overlapping peak is present from the sample vial, it may be necessary to consider evaluation by peak ratio or multivariate analysis.
- If the sample is colored (for example, whiskey), the excitation wavelength needs to be considered to avoid fluorescence.
- In this application note the calibration curve was created using Excel.
- Differences from other instruments are as follows:
FT/IR Can be measured with a small amount of sample, but cannot be measured through a vial.
UV/Vis Spectrometer Ethanol has no absorption in the UV-Vis region and must be quantified colorimetrically.
Keywords
200-AN-0029, Raman spectroscopy, ethanol, quantification, macro