Component Analysis of an Excitation-Emission Matrix of Water Samples Using PARAFAC Analysis
January 5, 2024
Introduction
Parallel Factor Analysis (PARAFAC) is a type of multivariable analysis, which can be used to extract the components from mixed 3D fluorescence data. JASCO has developed an advanced solution using PARAFAC, which can help to interpret the complicated data found in the EEM.
Excitation-Emission Matrix (EEM) can be used in a wide variety of applications, especially in the analysis of environmental water. EEM can provide the information such as; (1) The origin of environmental water and chromophoric dissolved organic matter (CDOM), (2) Monitoring of component variation from influences such as climate patterns or local weather.
Environmental water typically contains a variety of fluorescent materials (humic acid, fulvic acid, protein, amino acids, chlorophyll, synthetic compounds etc.). Analysis using EEM with many fluorescence peaks results in very complicated data which can be difficult to interpret.
As an example of component analysis by PARAFAC, this application note shows the 3D fluorescence measurement and component analysis results of a mixed sample (Tryptophan, humic acid and fulvic acid).
Experimental

Solutions of tryptophan (0.0175 mg/L), humic acid (0.5 mg/L) and fulvic acid (1 mg/L) were prepared in the following mixture ratios (tryptophan: humic acid: fulvic acid): 6:2:2, 5:5:0, 5:0:5, 4:4:2, 4:2:4, 2:6:2, 2:4:4, 2:2:6, 0:5:5.
The excitation and emission spectra were measured and corrected using calibrated light sources (WI and D2).
Keywords
190-FP-0020B, FP-8300, Fluorescence, PARAFAC (Parallel Factor Analysis), EEM (Excitation-Emission Matrix), CDOM (Chromophoric Dissolved Organic Matter), IFE (Inner Filter Effect)
Results
The 3D fluorescence spectra of ultra pure water and sample were obtained and corrected for using the calibrated excitation emission spectra. The ultra pure water spectra were then subtracted from the sample spectra to remove the water Raman peaks. The subtracted sample spectra are shown in Figure 1.
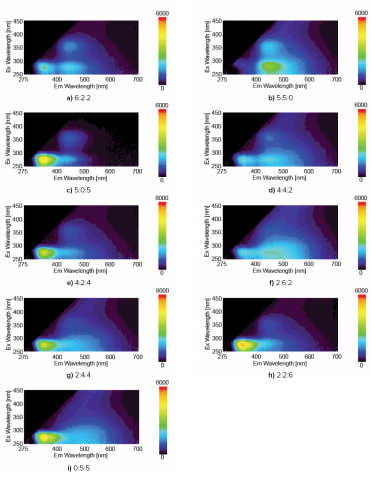
Figure 1. 3D fluorescence spectra of the different mixture ratios (tryptophan: humic acid: fulvic acid).
Component analysis using PARAFAC analysis was performed on the 3D fluorescence data and the number of component spectra was set as 3. Figure 2, left shows the component spectra calculated by PARAFAC, and Figure 2, right shows the 3D fluorescence data of the pure sample (tryptophan, humic acid and fulvic acid). As shown in Figure 2, the component spectra are closely similar to the 3D fluorescence data of the pure sample.
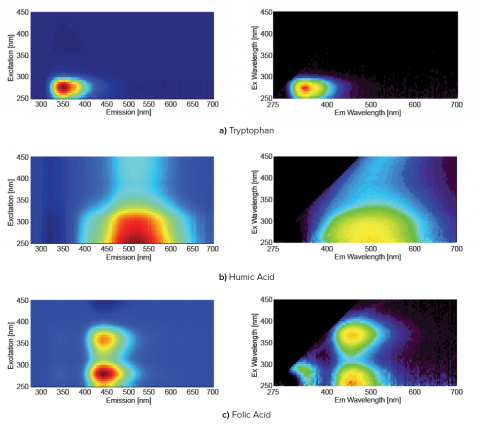 Figure 2. 3D fluorescence spectra of the pure samples (right) and component spectra by PARAFAC (left).
Figure 3 shows the score plot of the first component (tryptophan) and the second component (humic acid) as calculated by PARAFAC. The ratio of the components calculated by PARAFAC is similar to the mixture ratio of tryptophan and humic acid.
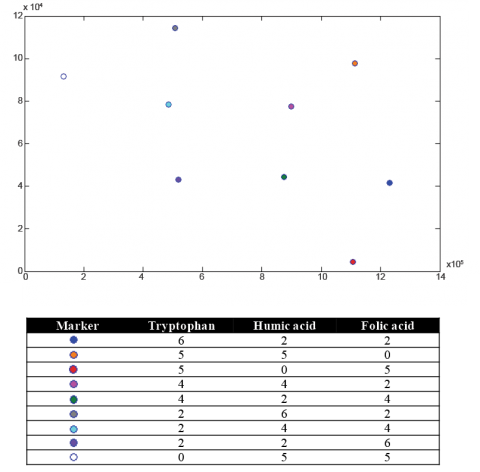
Figure 3. Score plot of tryptophan and humic acid.
Conclusion
These results demonstrate that PARAFAC analysis is useful for the identification of a component spectrum from a mixed spectrum, and can be used to determine the components in a mixed solution from the peak information of each component spectrum. PARAFAC can also be used to provide quantitative analysis for each component in the mixture.
Required Products and Software
- FP-8200/8300/8500/8600/8700 Spectrofluorometer
- ESC-842 Calibrated WI Light Source
- ESC-843 Calibrated D2 Light Source
References
1. R. Brodersen, J. Biol. Chem. (1977) 252, 14, 5067-5072.
2. U. Kragh-Hansen, Biochem. J. (1983) 209, 135-142.
3. Sinha, S. S., Mitra, R. K., and S. K. Pal, J. Phys. Chem.B. (2008) 112, 4884-4891
Featured Products:
-
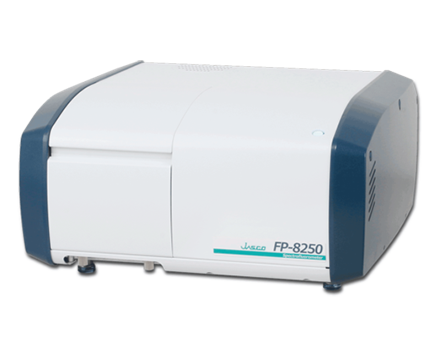
Simple and sensitive system which readily accommodates routine measurements and accessories, such as spectral scanning, quantitation, and temperature control.
FP-8250 Spectrofluorometer
-
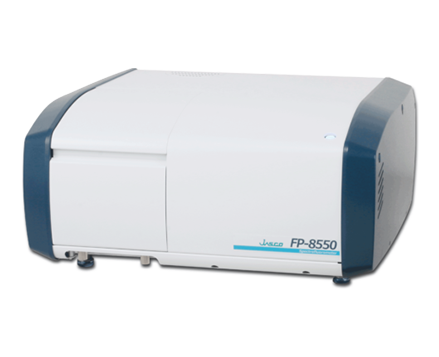
Sophisticated optical system offering the ultimate in sensitivity, spectral accuracy, and flexibility for the most challenging materials and biological samples.
FP-8550 Spectrofluorometer
-
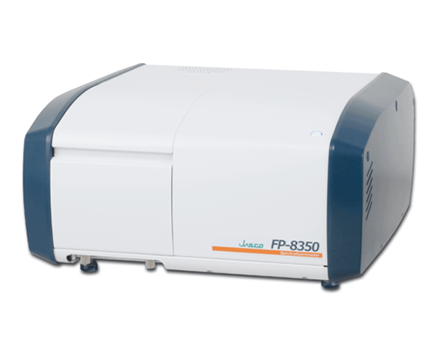
A powerful combination of performance, sensitivity and flexibility for biological, environmental and materials analysis.
FP-8350 Spectrofluorometer

Component Analysis of an Excitation-Emission Matrix of Water Samples Using PARAFAC Analysis
Introduction
Parallel Factor Analysis (PARAFAC) is a type of multivariable analysis, which can be used to extract the components from mixed 3D fluorescence data. JASCO has developed an advanced solution using PARAFAC, which can help to interpret the complicated data found in the EEM.
Excitation-Emission Matrix (EEM) can be used in a wide variety of applications, especially in the analysis of environmental water. EEM can provide the information such as; (1) The origin of environmental water and chromophoric dissolved organic matter (CDOM), (2) Monitoring of component variation from influences such as climate patterns or local weather.
Environmental water typically contains a variety of fluorescent materials (humic acid, fulvic acid, protein, amino acids, chlorophyll, synthetic compounds etc.). Analysis using EEM with many fluorescence peaks results in very complicated data which can be difficult to interpret.
As an example of component analysis by PARAFAC, this application note shows the 3D fluorescence measurement and component analysis results of a mixed sample (Tryptophan, humic acid and fulvic acid).
Experimental

Solutions of tryptophan (0.0175 mg/L), humic acid (0.5 mg/L) and fulvic acid (1 mg/L) were prepared in the following mixture ratios (tryptophan: humic acid: fulvic acid): 6:2:2, 5:5:0, 5:0:5, 4:4:2, 4:2:4, 2:6:2, 2:4:4, 2:2:6, 0:5:5.
The excitation and emission spectra were measured and corrected using calibrated light sources (WI and D2).
Results
The 3D fluorescence spectra of ultra pure water and sample were obtained and corrected for using the calibrated excitation emission spectra. The ultra pure water spectra were then subtracted from the sample spectra to remove the water Raman peaks. The subtracted sample spectra are shown in Figure 1.

Figure 1. 3D fluorescence spectra of the different mixture ratios (tryptophan: humic acid: fulvic acid).
Component analysis using PARAFAC analysis was performed on the 3D fluorescence data and the number of component spectra was set as 3. Figure 2, left shows the component spectra calculated by PARAFAC, and Figure 2, right shows the 3D fluorescence data of the pure sample (tryptophan, humic acid and fulvic acid). As shown in Figure 2, the component spectra are closely similar to the 3D fluorescence data of the pure sample.
 Figure 2. 3D fluorescence spectra of the pure samples (right) and component spectra by PARAFAC (left).
Figure 3 shows the score plot of the first component (tryptophan) and the second component (humic acid) as calculated by PARAFAC. The ratio of the components calculated by PARAFAC is similar to the mixture ratio of tryptophan and humic acid.

Figure 3. Score plot of tryptophan and humic acid.
Conclusion
These results demonstrate that PARAFAC analysis is useful for the identification of a component spectrum from a mixed spectrum, and can be used to determine the components in a mixed solution from the peak information of each component spectrum. PARAFAC can also be used to provide quantitative analysis for each component in the mixture.
Keywords
190-FP-0020B, FP-8300, Fluorescence, PARAFAC (Parallel Factor Analysis), EEM (Excitation-Emission Matrix), CDOM (Chromophoric Dissolved Organic Matter), IFE (Inner Filter Effect)
Required Products and Software
- FP-8200/8300/8500/8600/8700 Spectrofluorometer
- ESC-842 Calibrated WI Light Source
- ESC-843 Calibrated D2 Light Source
References
1. R. Brodersen, J. Biol. Chem. (1977) 252, 14, 5067-5072.
2. U. Kragh-Hansen, Biochem. J. (1983) 209, 135-142.
3. Sinha, S. S., Mitra, R. K., and S. K. Pal, J. Phys. Chem.B. (2008) 112, 4884-4891

 Download This Application