Advanced FTIR Imaging System with Linear Array MCT Detector
May 3, 2024
 Download This Application
Introduction
Advanced FTIR Imaging Microscope with Linear Array Detector
In recent years we have seen an explosive growth in the applications of the FTIR Imaging Microscope and the data resulting from these imaging systems. From materials research to the imaging of cancer cells and disease as well as uses as a quality control tool for polymers and pharmaceuticals. FTIR imaging microscopes are now used in many different laboratories around the globe. As new challenges emerge for the analysis of samples, the FTIR imaging system must provide a solution for these types of analyses. An imaging FTIR imaging microscope with a linear array (LA) detector provides a rapid, powerful tool for the examination of a wide array of samples and combining this flexible imaging system with advanced image processing software can easily provide visually relevant data.
An FTIR imaging microscope systems can provide a simple spectrum of a very small contaminant in a larger matrix or detailed information about the distribution of the chemical constituents together with spatial information, i.e., the variation and distribution of layers in a polymer laminate. In the past, FTIR imaging microscopes and imaging systems have been the realm of research laboratories or users with extensive experience in infrared spectroscopy. However, with the ability to integrate an FTIR microscope with even the lowest level FTIR spectrometer, the IRT-5000/7000 Series brings FTIR microscopy within reach of routine users. The decreased cost of ownership allows access to more users than ever before. The Spectra Manager Imaging Suite provides simplicity of operation as well as advanced imaging analysis, using functional group identification and chemometrics. The IRT-5000/7000 Series microscopes are designed to be functionally upgradeable to accommodate the current and future needs of all users, and offer extended flexibility as the needs of the laboratory grow.
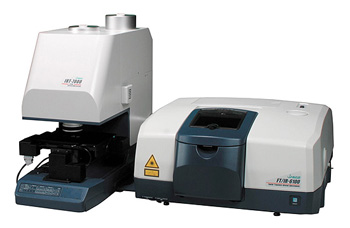
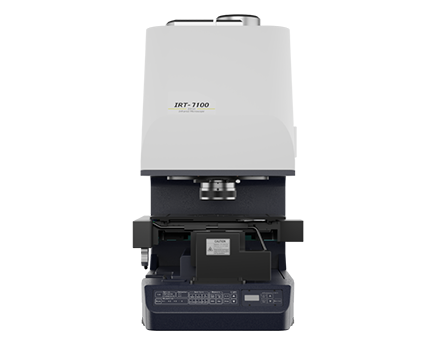
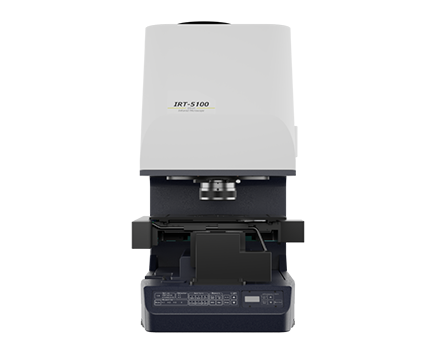
The IRT-5000 FTIR imaging microscope system, in its basic configuration, can be installed with a manual stage and a single-element MCT detector, it can also be upgraded with the addition of an XYZ auto-stage for mapping and with a multi-element linear array detector for fast imaging. Alternatively, the IRT-7000 can be specified (Figure 1) as an imaging system with both a single-element and linear array MCT detectors with an XYZ auto-stage. The single-element MCT detector on either system can also be specified as user-swappable, providing the option to quickly exchange the single-element MCT detector for other detectors such as an InGaAs or InSb detector for NIR measurement or a DLaTGS detector for operation without liquid nitrogen, and with an extended mid-IR spectral range. The objective carousel has up to 4 positions for various cassegrains or refractive objectives as well as interchangeable ATR objectives. The IRT-5000/7000 Series offers a wide range of sample visualization and measurement. Any of these options can be added to the microscope system in the future, providing the ability to expand the applications of the system to fast imaging, kinetics, thermal or environmental control and many other applications.
Experimental
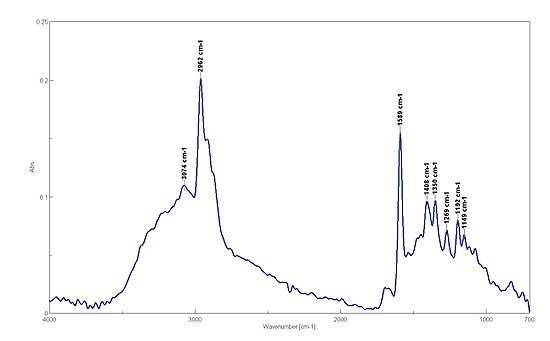
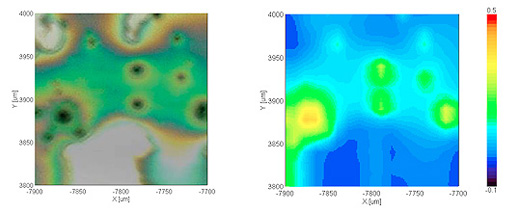
Data was collected using a FT/IR-6300 with IRT-7000 microscope. Sample spectra were collected with spectral resolutions ranging from 4 to 16 cm-1, with various accumulated scans for background and sample spectra as outlined below. Figure 2 illustrates a video image (left) and infrared mapping image (right) of an ink stain on a reflective metal plate. This data was collected using IQ Mapping -mapping of a sample can be made using either the single point or multi-point detectors without moving the auto-stage. Scanning mirrors before and after the cassegrain objective are moved to collect data from the full planar area of the cassegrain focus. This function can increase the speed of mapping or imaging data collection or can be used with the manual stage to provide mapping capability without the requirement for an automated XYZ stage. The mapping image was made using the peak height of the C-H stretch of an ink at 2962 cm-1, the spectrum is shown in Figure 4. The spectral data displayed in Figs. 2 and 3 were collected using eight scans per pixel at 16 cm-1 resolution using a 12.5 x 12.5 µm aperture, the total area of 200 x 200 µm was imaged in a little over one minute.
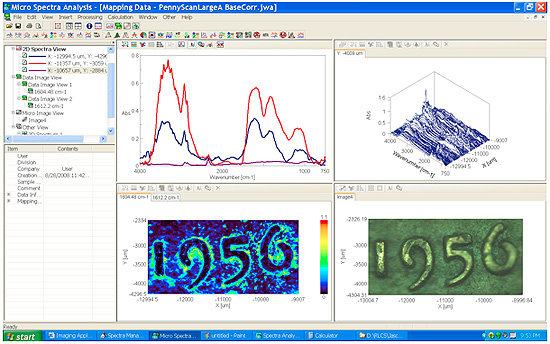
The infrared spectral image can be displayed as ‘false color’ maps based on peak intensity, calculation of peak height/ratio or peak area/ratio. Additional calculations can also provide images based on peak shift or full-width at half maximum values. Imaging from these calculations can also be displayed as contour maps of the peak information and 3D images to provide image contrast for information purposes. These various options are all available in the Spectra Manager Imaging Suite (Figure 4). Spectra Manager can also display the automatically collected video images as well as individual spectra, image maps and calculated data for easy interpretation. If data is collected from multiple points in the sample, individual spectra can be selected together with the captured video image from each sample area. The analysis software can be used during sample measurement, providing simultaneous operation of the microscope and analysis of previously acquired data. The imaging data displayed in Figure 4 is obtained from the area around the minting date of a penny coin, the ‘yellow’ image areas are from the skin proteins embedded around the raised metal of the date stamp. The image was collected with the linear array detector using 16 scans at 16 cm-1 resolution per 12.5 x 12.5 µm pixel, the total area of 2 x 4 mm imaged in approx. 35 minutes (a total of 50,560 individual spectra).
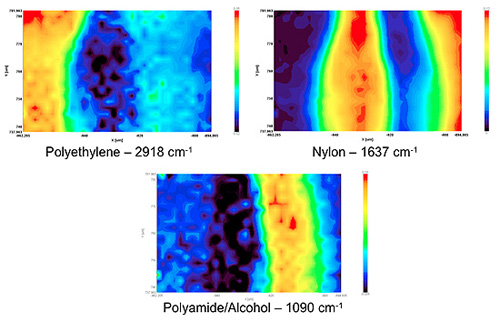
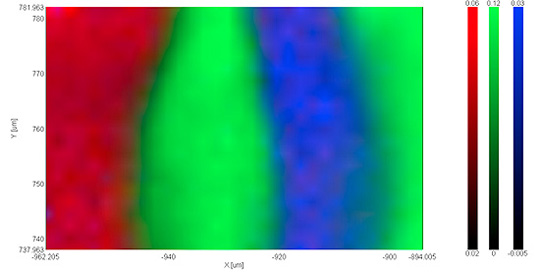
Another example of the data display capabilities is shown in Figs. 5 and 6, ATR spectral images were collected from a polymer laminate. The individual spectral images are shown in Figure 5, imaging is based on specific absorption peaks in polyethylene, nylon and polyvinyl alcohol found in the laminate. Overlaying the individual images provides a ‘composite’ image shown in Figure 6, which provides a clear display of the margins of the individual components and any overlap of the spectral data obtained by the ATR mapping experiment. Data from a 68 x 44 µm area was collected using IQ mapping, mapping through the Ge ATR element using the linear array detector with 64 spectral accumulations at 8 cm-1 resolution. The 672 spectra of 2.2 x 2.2 µm spatial resolution required only eight minutes for collection of the sample image data.
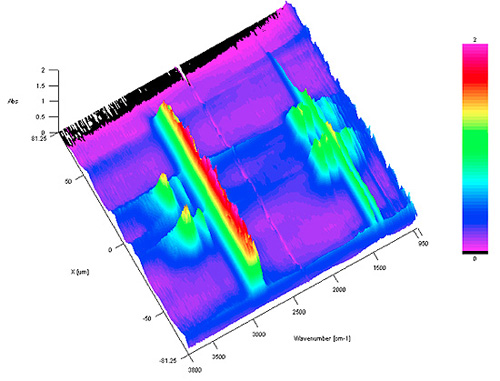
For the analysis of polymer laminates, information concerning the identity and spatial distribution of the various layers can be of critical importance, verifying the production of the laminate or providing information on a competitive product. Collection of the ‘line-map’ data using a very small aperture can provide information about the laminate layers and their spatial arrangement. Figure 7 outlines the various spectra of a polymer laminate cross-section collected in transmission mode. The 3D display of the spectra as shown were collected with a 5 x 50 µm aperture, using 8 cm-1 resolution and 128 accumulations per spectrum with the single-point MCT detector on the IRT-7000 imaging system. The various spectra in the figure provided identification of the polyethylene, polypropylene and nylon layers of the laminate as well as the spatial distribution of the individual polymer layers. Individual spectra from the image map were selected and verified with a spectral search library while the spatial distribution of the laminate layers was determined from cross-section calculations of the significant spectral peaks of each component. The figure readily demonstrates the different spectra and spatial distribution and can be easily rotated using the mouse, providing rapid visualization of features of interest within the sample image.
Conclusion
The IRT-5000/7000 series FTIR microscope imaging systems provide a simple upgrade path from a basic, single-element detector microscope accessory to a multi-element detector imaging system. The Spectra Manager Imaging Suite provides a wide range of options for data analysis for a many different sample types, as well as powerful and versatile sample imaging. The IRT microscopes can be added to any FT/IR-4000 or FT/IR-6000 Series instrument, providing microscopy or imaging for a simple instrument to a research-grade spectrometer.
Featured Products:
-
The IRT-7000 16-element linear array microscope for fast imaging and kinetics.
IRT-7000 FTIR Microscope
-
The IRT-5000 is an innovative FTIR microscope with powerful sample identification and imaging.
IRT-5000 Series FTIR Microscopes
-
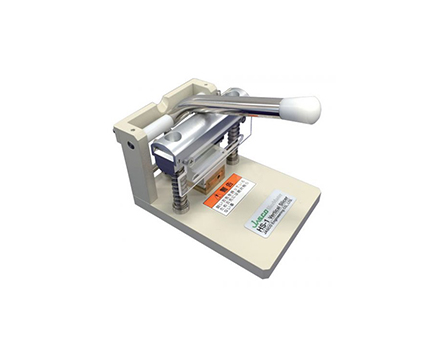
For cutting samples at a fixed angle of 90 degrees
HS-1 Vertical Slicer

Advanced FTIR Imaging System with Linear Array MCT Detector
Introduction
Advanced FTIR Imaging Microscope with Linear Array Detector
In recent years we have seen an explosive growth in the applications of the FTIR Imaging Microscope and the data resulting from these imaging systems. From materials research to the imaging of cancer cells and disease as well as uses as a quality control tool for polymers and pharmaceuticals. FTIR imaging microscopes are now used in many different laboratories around the globe. As new challenges emerge for the analysis of samples, the FTIR imaging system must provide a solution for these types of analyses. An imaging FTIR imaging microscope with a linear array (LA) detector provides a rapid, powerful tool for the examination of a wide array of samples and combining this flexible imaging system with advanced image processing software can easily provide visually relevant data.
An FTIR imaging microscope systems can provide a simple spectrum of a very small contaminant in a larger matrix or detailed information about the distribution of the chemical constituents together with spatial information, i.e., the variation and distribution of layers in a polymer laminate. In the past, FTIR imaging microscopes and imaging systems have been the realm of research laboratories or users with extensive experience in infrared spectroscopy. However, with the ability to integrate an FTIR microscope with even the lowest level FTIR spectrometer, the IRT-5000/7000 Series brings FTIR microscopy within reach of routine users. The decreased cost of ownership allows access to more users than ever before. The Spectra Manager Imaging Suite provides simplicity of operation as well as advanced imaging analysis, using functional group identification and chemometrics. The IRT-5000/7000 Series microscopes are designed to be functionally upgradeable to accommodate the current and future needs of all users, and offer extended flexibility as the needs of the laboratory grow.
The IRT-5000 FTIR imaging microscope system, in its basic configuration, can be installed with a manual stage and a single-element MCT detector, it can also be upgraded with the addition of an XYZ auto-stage for mapping and with a multi-element linear array detector for fast imaging. Alternatively, the IRT-7000 can be specified (Figure 1) as an imaging system with both a single-element and linear array MCT detectors with an XYZ auto-stage. The single-element MCT detector on either system can also be specified as user-swappable, providing the option to quickly exchange the single-element MCT detector for other detectors such as an InGaAs or InSb detector for NIR measurement or a DLaTGS detector for operation without liquid nitrogen, and with an extended mid-IR spectral range. The objective carousel has up to 4 positions for various cassegrains or refractive objectives as well as interchangeable ATR objectives. The IRT-5000/7000 Series offers a wide range of sample visualization and measurement. Any of these options can be added to the microscope system in the future, providing the ability to expand the applications of the system to fast imaging, kinetics, thermal or environmental control and many other applications.
Experimental
Data was collected using a FT/IR-6300 with IRT-7000 microscope. Sample spectra were collected with spectral resolutions ranging from 4 to 16 cm-1, with various accumulated scans for background and sample spectra as outlined below. Figure 2 illustrates a video image (left) and infrared mapping image (right) of an ink stain on a reflective metal plate. This data was collected using IQ Mapping -mapping of a sample can be made using either the single point or multi-point detectors without moving the auto-stage. Scanning mirrors before and after the cassegrain objective are moved to collect data from the full planar area of the cassegrain focus. This function can increase the speed of mapping or imaging data collection or can be used with the manual stage to provide mapping capability without the requirement for an automated XYZ stage. The mapping image was made using the peak height of the C-H stretch of an ink at 2962 cm-1, the spectrum is shown in Figure 4. The spectral data displayed in Figs. 2 and 3 were collected using eight scans per pixel at 16 cm-1 resolution using a 12.5 x 12.5 µm aperture, the total area of 200 x 200 µm was imaged in a little over one minute.
The infrared spectral image can be displayed as ‘false color’ maps based on peak intensity, calculation of peak height/ratio or peak area/ratio. Additional calculations can also provide images based on peak shift or full-width at half maximum values. Imaging from these calculations can also be displayed as contour maps of the peak information and 3D images to provide image contrast for information purposes. These various options are all available in the Spectra Manager Imaging Suite (Figure 4). Spectra Manager can also display the automatically collected video images as well as individual spectra, image maps and calculated data for easy interpretation. If data is collected from multiple points in the sample, individual spectra can be selected together with the captured video image from each sample area. The analysis software can be used during sample measurement, providing simultaneous operation of the microscope and analysis of previously acquired data. The imaging data displayed in Figure 4 is obtained from the area around the minting date of a penny coin, the ‘yellow’ image areas are from the skin proteins embedded around the raised metal of the date stamp. The image was collected with the linear array detector using 16 scans at 16 cm-1 resolution per 12.5 x 12.5 µm pixel, the total area of 2 x 4 mm imaged in approx. 35 minutes (a total of 50,560 individual spectra).
Another example of the data display capabilities is shown in Figs. 5 and 6, ATR spectral images were collected from a polymer laminate. The individual spectral images are shown in Figure 5, imaging is based on specific absorption peaks in polyethylene, nylon and polyvinyl alcohol found in the laminate. Overlaying the individual images provides a ‘composite’ image shown in Figure 6, which provides a clear display of the margins of the individual components and any overlap of the spectral data obtained by the ATR mapping experiment. Data from a 68 x 44 µm area was collected using IQ mapping, mapping through the Ge ATR element using the linear array detector with 64 spectral accumulations at 8 cm-1 resolution. The 672 spectra of 2.2 x 2.2 µm spatial resolution required only eight minutes for collection of the sample image data.
For the analysis of polymer laminates, information concerning the identity and spatial distribution of the various layers can be of critical importance, verifying the production of the laminate or providing information on a competitive product. Collection of the ‘line-map’ data using a very small aperture can provide information about the laminate layers and their spatial arrangement. Figure 7 outlines the various spectra of a polymer laminate cross-section collected in transmission mode. The 3D display of the spectra as shown were collected with a 5 x 50 µm aperture, using 8 cm-1 resolution and 128 accumulations per spectrum with the single-point MCT detector on the IRT-7000 imaging system. The various spectra in the figure provided identification of the polyethylene, polypropylene and nylon layers of the laminate as well as the spatial distribution of the individual polymer layers. Individual spectra from the image map were selected and verified with a spectral search library while the spatial distribution of the laminate layers was determined from cross-section calculations of the significant spectral peaks of each component. The figure readily demonstrates the different spectra and spatial distribution and can be easily rotated using the mouse, providing rapid visualization of features of interest within the sample image.
Conclusion
The IRT-5000/7000 series FTIR microscope imaging systems provide a simple upgrade path from a basic, single-element detector microscope accessory to a multi-element detector imaging system. The Spectra Manager Imaging Suite provides a wide range of options for data analysis for a many different sample types, as well as powerful and versatile sample imaging. The IRT microscopes can be added to any FT/IR-4000 or FT/IR-6000 Series instrument, providing microscopy or imaging for a simple instrument to a research-grade spectrometer.