Protein secondary structure analysis in low concentration aqueous solutions
October 8, 2024
 Download This Application
Introduction
Infrared spectroscopy is an effective technique for component analysis and interaction analysis of biological samples such as proteins, sugars and lipids. FTIR spectroscopy can be used to measure solid and liquid samples when applied to secondary structure analysis of proteins.
JASCO has previously reported the study of aqueous protein solutions*1. In this application note, we report results from the ATR PRO PENTA an optimal system for measuring low concentration aqueous solutions. The ATR PRO PENTA has been designed with an optimum number of reflections so that water absorption is not saturated. Furthermore, the use of an FTIR spectrometer with highly sensitive MCT detector allows measurement of samples with very low sample concentrations, which were previously difficult to measure. Here we report the results of measurement of three examples of low concentration protein aqueous solution.
Features
– ATR easy sampling accessory
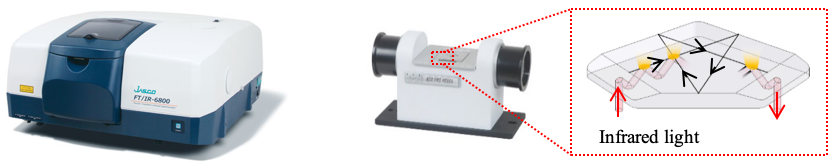
– Unique pentagonal prism shape
– 14 reflections in a Ge prism (Figure 1)
– High sensitivity measurement in combination with an MCT detector
– Sample volume of only a few microliters
*1 FT/IR Application Note: 210-TR-0127
Experimental
Analysis of low concentration protein aqueous solution
The following three protein aqueous solutions (0.01% w / v) were prepared and IR spectra measured using an ATR PRO PENTA. Secondary structure estimation (SSE) was performed by taking the difference spectrum with water.
1: Lysozyme (Chicken Egg White)
2: Concanavalin A
3: Trypsin inhibitor Kunitz
| Measurement Conditions | |||
| Main Unit | FT/IR-6800 | Accumulation | 90 times |
| Accessory | ATR PRO PENTA | Resolution | 4cm-1 |
| Detector | MCT (PV type) | ||
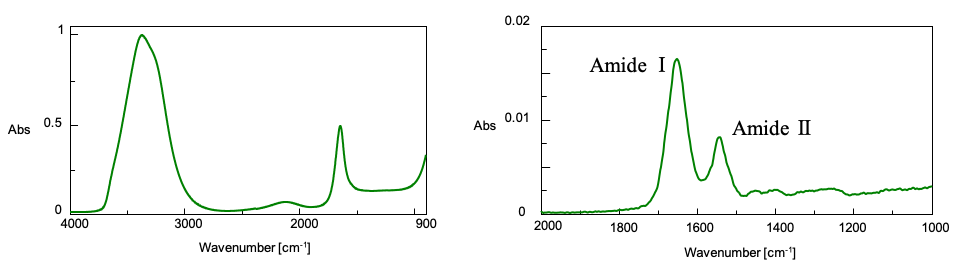
Figure 2 shows the IR spectrum of 0.01% Lysozyme aqueous solution and the difference spectrum with water. In the difference spectrum, protein amide I and amide II bands were clearly observed.
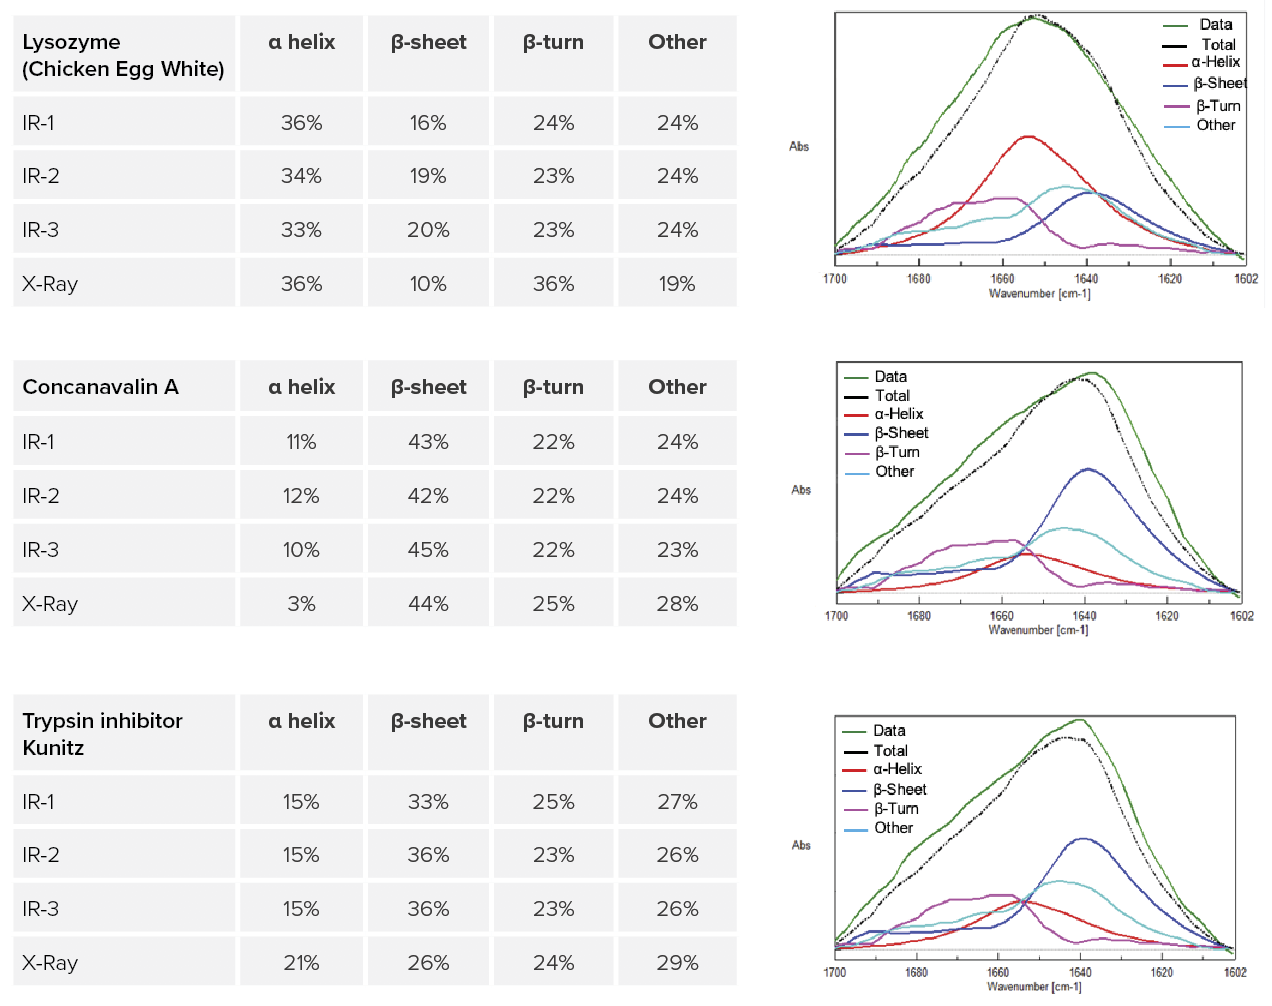
The SSE result of the amide I band of the ATR-corrected difference spectrum and the reference value*2 by X-ray diffraction are shown. Each sample was measured in triplicate and all were in good correlation with the reference value. From this result, it was shown that ATR PRO PENTA is effective*3 for analysis of low concentration protein aqueous solutions.
*2 Sarver, R. W., Krueger, W. C., 1991. Anal. Biochem., 194, 89-100.
*3 Depending on the type of protein, it may adsorb on the prism and affect the results
Keywords
210-TR-0127, Secondary structure estimation, low concentration, ATR, multiple bounces, MCT detector, proteins
Results
| Model | Description | Part Number | |
| Main Unit | FT/IR-6800 | FT/IR Spectrometer | 7085-J006A*1 |
| Detector | MCT-6000PV | MCT(PV) detector | 6584-J345A*2 |
| Attachment | ATR PRO PENTA | Multi reflection ATR | 6584-J343A |
| Software | IR SSE-4000 | Secondary structure estimation program | 4880-7234A |
*1 FT/IR-4600/4700 and FT/IR-6600/6700 are also available.
*2 When using FT/IR-4600/4700, MCT-4000PV should be used.
Featured Products:
-
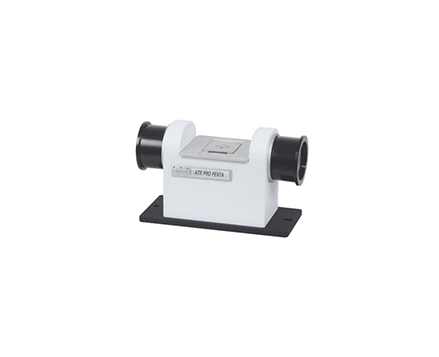
A 14 bounce, high-sensitivity ATR prism
ATR Penta

Protein secondary structure analysis in low concentration aqueous solutions
Introduction
Infrared spectroscopy is an effective technique for component analysis and interaction analysis of biological samples such as proteins, sugars and lipids. FTIR spectroscopy can be used to measure solid and liquid samples when applied to secondary structure analysis of proteins.
JASCO has previously reported the study of aqueous protein solutions*1. In this application note, we report results from the ATR PRO PENTA an optimal system for measuring low concentration aqueous solutions. The ATR PRO PENTA has been designed with an optimum number of reflections so that water absorption is not saturated. Furthermore, the use of an FTIR spectrometer with highly sensitive MCT detector allows measurement of samples with very low sample concentrations, which were previously difficult to measure. Here we report the results of measurement of three examples of low concentration protein aqueous solution.
Features
– ATR easy sampling accessory
– Unique pentagonal prism shape
– 14 reflections in a Ge prism (Figure 1)
– High sensitivity measurement in combination with an MCT detector
– Sample volume of only a few microliters
*1 FT/IR Application Note: 210-TR-0127
Experimental
Analysis of low concentration protein aqueous solution
The following three protein aqueous solutions (0.01% w / v) were prepared and IR spectra measured using an ATR PRO PENTA. Secondary structure estimation (SSE) was performed by taking the difference spectrum with water.
1: Lysozyme (Chicken Egg White)
2: Concanavalin A
3: Trypsin inhibitor Kunitz
| Measurement Conditions | |||
| Main Unit | FT/IR-6800 | Accumulation | 90 times |
| Accessory | ATR PRO PENTA | Resolution | 4cm-1 |
| Detector | MCT (PV type) | ||
Figure 2 shows the IR spectrum of 0.01% Lysozyme aqueous solution and the difference spectrum with water. In the difference spectrum, protein amide I and amide II bands were clearly observed.
The SSE result of the amide I band of the ATR-corrected difference spectrum and the reference value*2 by X-ray diffraction are shown. Each sample was measured in triplicate and all were in good correlation with the reference value. From this result, it was shown that ATR PRO PENTA is effective*3 for analysis of low concentration protein aqueous solutions.
*2 Sarver, R. W., Krueger, W. C., 1991. Anal. Biochem., 194, 89-100.
*3 Depending on the type of protein, it may adsorb on the prism and affect the results
Results
| Model | Description | Part Number | |
| Main Unit | FT/IR-6800 | FT/IR Spectrometer | 7085-J006A*1 |
| Detector | MCT-6000PV | MCT(PV) detector | 6584-J345A*2 |
| Attachment | ATR PRO PENTA | Multi reflection ATR | 6584-J343A |
| Software | IR SSE-4000 | Secondary structure estimation program | 4880-7234A |
*1 FT/IR-4600/4700 and FT/IR-6600/6700 are also available.
*2 When using FT/IR-4600/4700, MCT-4000PV should be used.
Keywords
210-TR-0127, Secondary structure estimation, low concentration, ATR, multiple bounces, MCT detector, proteins