Overview of the ATR PRO PENTA
The ATR method is widely for measuring solutions without the need for sample preparation, but since the current mainstream single-reflection ATR requires a sample concentration on the order of several percent, it was challenging to measure low-concentration samples of less than 0.1% as required by many biological samples.

The newly developed ATR “ATR PRO PENTA” (Figure1), a highly sensitive multiple reflection ATR, can measure low concentration samples of 0.1% or less using small amounts of samples several microliters by adopting a uniquely designed 14-reflection Ge prism (Figure 2.).

Here, we introduce that this new ATR as a useful tool in the biochemistry field for samples such as lipids, sugars, and proteins.
Quantitation of low concentration solutions
The spectrum of 0.5%, 0.1%, and 0.05% sucrose aqueous solutions and their calibration curve is shown in Figure 3. Each spectrum is the spectrum of the sucrose aqueous solution, the difference spectrum by which the spectrum of water is subtracted. Very high linearity is obtained in concentration (Figure 3b). It suggests that ATR PRO PENTA is sufficiently quantifiable even for low concentration regions that are previously untestable.

* The quantitation limit of sucrose aqueous solution in this experiment was 0.042%, and the detection limit was 0.014%.

Secondary structure analysis of IR proteins using extremely low concentration samples
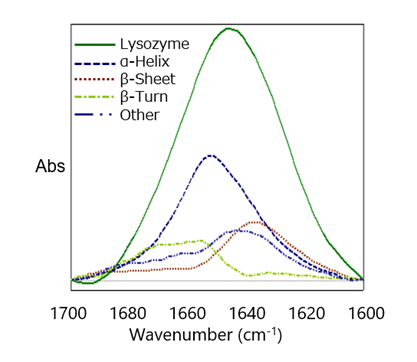
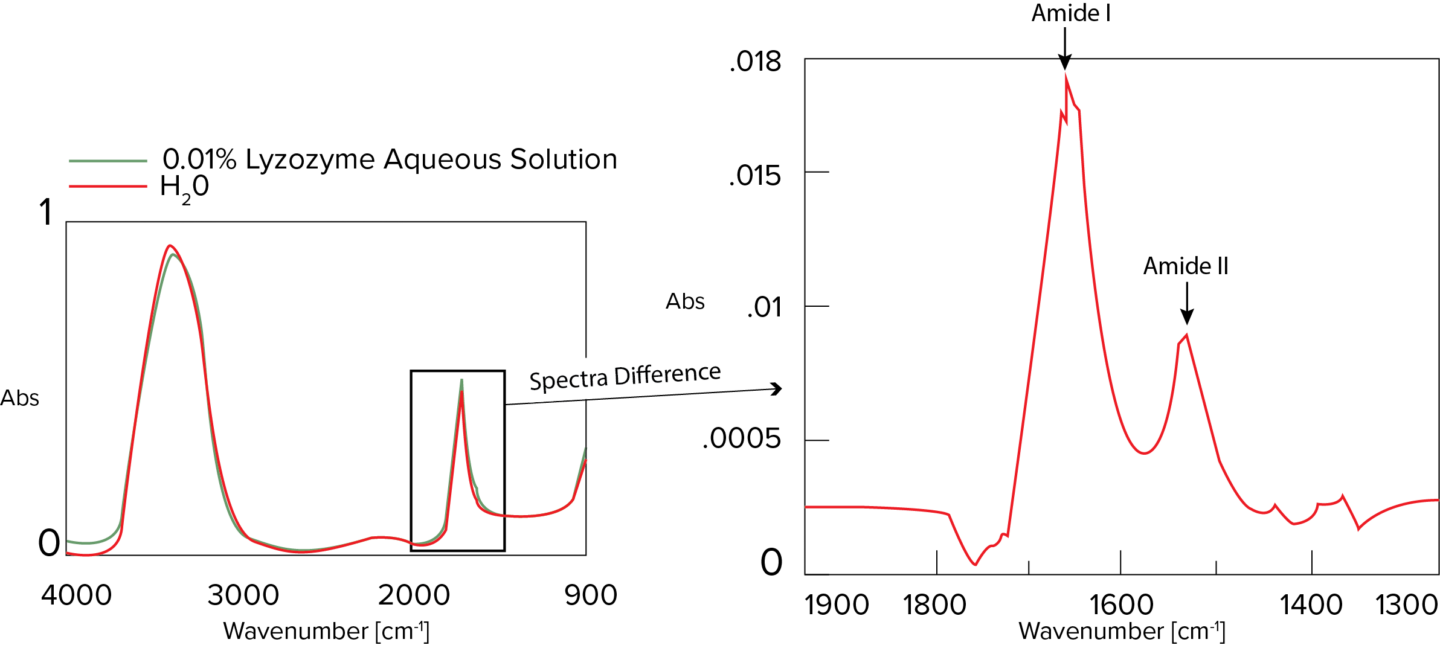
IR-SSE (IR protein secondary structure analysis) was performed using the spectrum (difference spectrum with water) of 0.01% lysozyme aqueous solution (Figure 5). Even at a low concentration of 0.01%, the peaks of amide I and amide II are clearly separated, and the peak shape is clear, so amide I information can be used for secondary structural analysis (Figure 6). Figure 7 shows the resulting concentration values. The results of the secondary structure analysis of the difference spectra measured using a heavy aqueous solution were reasonably consistent with 1 obtained by Sarver and his team [1].
[1] Sarver, R. W., Krueger, W.C., 1991. Anal. Biochem., 194, 89-100.
* Since proteins adsorb on Ge, the spectral intensity does not change if they are thinner than a certain concentration.
* Strong acids and strong alkalis cannot be measured as they damage the crystal.


SSE quantitation
Structure | Percentage (%) |
---|---|
α-Helix | 40 |
β-Sheet | 22 |
β-Turn | 18 |
Other | 20 |
・For a sucrose aqueous solution, a calibration curve with good linearity was obtained, and the detection limit was found to be 0.014%.
・Detection of lysozyme at a concentration of 0.01% was possible, and an SSE analysis was performed based on the Amide-I band in the difference spectrum.