A UV-Visible Spectrophotometer for Quantitative Chromaticity and Turbidity Measurements
March 5, 2025
 Download This Application
Introduction
UV-Visible Spectrophotometer
Quantitative chromaticity and turbidity measurements are used to check the degree of coloration and clarity of potable and waste water. Chromaticity is tested by adding humic acid to the test solution and observing the absorption at 390 nm (for the yellow color of the acid). Turbidity describes the relative clarity of a sample due to particulates, microbes, and organic substances. The degree of turbidity can be measured from the amount of light scattered by the materials in the sample using a UV-Visible spectrophotometer in transmission mode or using an integrating sphere.
This application note describes quantitative chromaticity and turbidity measurements using a UV-Visible spectrophotometer based on the clean water test method.
Keywords
UV-0014, V-630, V-650, UV-Visible/NIR, Chromaticity, Turbidity, LSE-701 Long pathlength cell holder, VWWQ-789 Chromaticity/turbidity measurement program, ISV-722/ISNN-723 Integrating sphere
Results
Chromaticity Measurements
Cobalt chloroplatinate has a color similar to the yellow-brown of humin and is used as the standard for the chromaticity measurements. 2.49 g of potassium chloroplatinate and 2.02 g of cobalt chloride were dissolved in 200 mL of hydrochloric acid. Purified water was then added to the solution to make a total volume of 1 L. This standard solution has a chromaticity value of 1000 degree. The standard levels used to create the absorbance calibration curve are prepared from the neat standard sample and diluted with purified water. Both the blank and water samples are filtering using a 0.2 μm membrane filter. Water samples can also be centrifuged with the supernatant used as the sample.
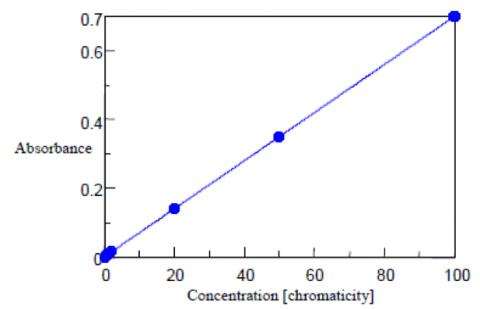
The absorption of the standards was measured at 390 nm using a 50 mm pathlength cell. The calibration curve is shown in Figure 1 and the corresponding values and calculated chromaticity results are shown in Table 1.
| Concentration (Chromaticity) | Absorbance | Calculated Chromaticity |
| 0 | 0.000 | -0.06 |
| 0.5 | 0.004 | 0.51 |
| 1 | 0.007 | 0.97 |
| 2 | 0.015 | 2.04 |
| 20 | 0.141 | 20.07 |
| 50 | 0.350 | 49.99 |
| 100 | 0.699 | 99.99 |
From the above results, the standard deviation (σ) between the obtained quantitative value and actual chromaticity is 0.04(6) degree, the detection limit is 0.15, and the quantitation limit is 0.46 degree. The detection limit is calculated from 3.3σ while the quantitative limit is calculated from 10σ.
Turbidity Measurements
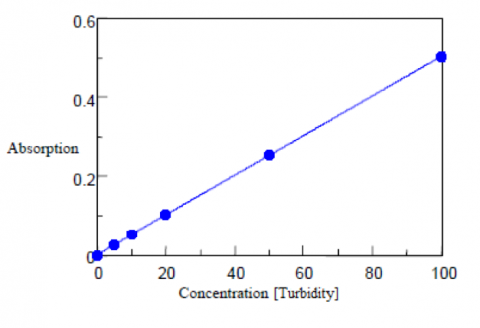
An immiscible polystyrene suspension is used as the standard sample for the turbidity measurements. Five standard suspensions of polystyrene particles with a turbidity at 100 are shown in Table 2 along with their corresponding mixing ratios and diameters. To create the calibration curve, the standards are diluted with purified water at 0, 5, 10, 50, and 100 degrees and measured in transmission mode using a 20 mm pathlength cell. Purified water filtered using a 0.2 μm membrane is used as the blank solution. The calibration curve and corresponding results are shown in Figure 2 and Table 3. The standard deviation is also calculated as 0.36 degree, the detection limit as 1.18, and the quantitation limit as 3.6 degrees.
| Concentration (Chromaticity) | Absorbance | Calculated Chromaticity |
| 0 | 0.000 | -0.27 |
| 5 | 0.026 | 4.81 |
| 10 | 0.052 | 10.07 |
| 20 | 0.102 | 20.09 |
| 50 | 0.256 | 50.64 |
| 100 | 0.502 | 99.67 |
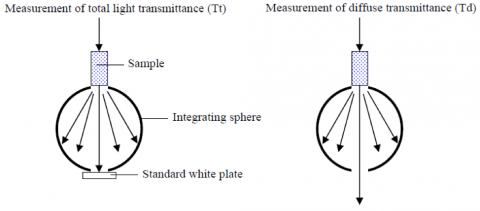
The blank and standards were then diluted in purified water to the final concentrations listed in Table 4 and measured using a 20 mm pathlength cell and an integrating sphere to obtain the diffuse transmittance. A standard white diffuser plate was first mounted in the integrating sphere and the total light (Tt) at 660 nm was measured. The plate was removed and the diffuse transmittance (Td) of the sample was then measured.
The turbidity is calculated from the diffuse transmittance results and are shown in Table 4, along with the calibration curve shown in Figure 4. The standard deviation is calculated as 0.08 degree, the detection limit as 0.28, and the quantitation limit as 0.86 degree. A 50 mm light pathlength rectangular cell is recommend to be used for the analysis of low turbidity samples with concentrations close to or less than the quantitation limit.

| Concentration (Turbidity) | Td/Tt•100 | Quantitative Value (Turbidity) |
| 0 | 0.004 | -0.05 |
| 0.5 | 0.389 | 0.50 |
| 1 | 0.726 | 0.98 |
| 2 | 1.435 | 1.99 |
| 5 | 3.666 | 5.17 |
| 10 | 7.003 | 9.92 |
Featured Products:
-
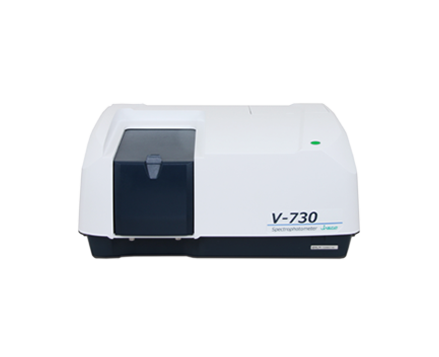
A general-purpose double-beam spectrophotometer with a compact space saving design
V-730 UV-Visible Spectrophotometer
-
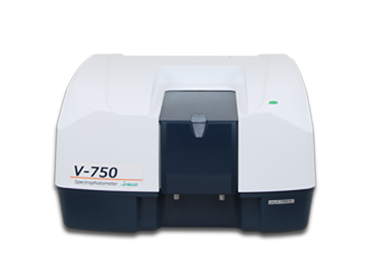
A high resolution UV-Visible double-beam spectrophotometer with single monochromator, variable SBW and PMT detector
V-750 UV-Visible Spectrophotometer
-
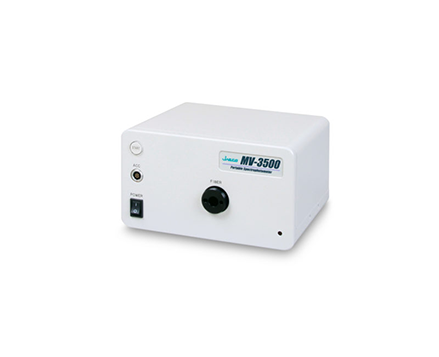
Modular UV-visible/NIR Spectrometer System
MV-3000 Series Portable UV-Visible/NIR Spectrophotometer

A UV-Visible Spectrophotometer for Quantitative Chromaticity and Turbidity Measurements
Introduction
UV-Visible Spectrophotometer
Quantitative chromaticity and turbidity measurements are used to check the degree of coloration and clarity of potable and waste water. Chromaticity is tested by adding humic acid to the test solution and observing the absorption at 390 nm (for the yellow color of the acid). Turbidity describes the relative clarity of a sample due to particulates, microbes, and organic substances. The degree of turbidity can be measured from the amount of light scattered by the materials in the sample using a UV-Visible spectrophotometer in transmission mode or using an integrating sphere.
This application note describes quantitative chromaticity and turbidity measurements using a UV-Visible spectrophotometer based on the clean water test method.
Results
Chromaticity Measurements
Cobalt chloroplatinate has a color similar to the yellow-brown of humin and is used as the standard for the chromaticity measurements. 2.49 g of potassium chloroplatinate and 2.02 g of cobalt chloride were dissolved in 200 mL of hydrochloric acid. Purified water was then added to the solution to make a total volume of 1 L. This standard solution has a chromaticity value of 1000 degree. The standard levels used to create the absorbance calibration curve are prepared from the neat standard sample and diluted with purified water. Both the blank and water samples are filtering using a 0.2 μm membrane filter. Water samples can also be centrifuged with the supernatant used as the sample.
The absorption of the standards was measured at 390 nm using a 50 mm pathlength cell. The calibration curve is shown in Figure 1 and the corresponding values and calculated chromaticity results are shown in Table 1.
| Concentration (Chromaticity) | Absorbance | Calculated Chromaticity |
| 0 | 0.000 | -0.06 |
| 0.5 | 0.004 | 0.51 |
| 1 | 0.007 | 0.97 |
| 2 | 0.015 | 2.04 |
| 20 | 0.141 | 20.07 |
| 50 | 0.350 | 49.99 |
| 100 | 0.699 | 99.99 |
From the above results, the standard deviation (σ) between the obtained quantitative value and actual chromaticity is 0.04(6) degree, the detection limit is 0.15, and the quantitation limit is 0.46 degree. The detection limit is calculated from 3.3σ while the quantitative limit is calculated from 10σ.
Turbidity Measurements
An immiscible polystyrene suspension is used as the standard sample for the turbidity measurements. Five standard suspensions of polystyrene particles with a turbidity at 100 are shown in Table 2 along with their corresponding mixing ratios and diameters. To create the calibration curve, the standards are diluted with purified water at 0, 5, 10, 50, and 100 degrees and measured in transmission mode using a 20 mm pathlength cell. Purified water filtered using a 0.2 μm membrane is used as the blank solution. The calibration curve and corresponding results are shown in Figure 2 and Table 3. The standard deviation is also calculated as 0.36 degree, the detection limit as 1.18, and the quantitation limit as 3.6 degrees.
| Concentration (Chromaticity) | Absorbance | Calculated Chromaticity |
| 0 | 0.000 | -0.27 |
| 5 | 0.026 | 4.81 |
| 10 | 0.052 | 10.07 |
| 20 | 0.102 | 20.09 |
| 50 | 0.256 | 50.64 |
| 100 | 0.502 | 99.67 |
The blank and standards were then diluted in purified water to the final concentrations listed in Table 4 and measured using a 20 mm pathlength cell and an integrating sphere to obtain the diffuse transmittance. A standard white diffuser plate was first mounted in the integrating sphere and the total light (Tt) at 660 nm was measured. The plate was removed and the diffuse transmittance (Td) of the sample was then measured.
The turbidity is calculated from the diffuse transmittance results and are shown in Table 4, along with the calibration curve shown in Figure 4. The standard deviation is calculated as 0.08 degree, the detection limit as 0.28, and the quantitation limit as 0.86 degree. A 50 mm light pathlength rectangular cell is recommend to be used for the analysis of low turbidity samples with concentrations close to or less than the quantitation limit.
| Concentration (Turbidity) | Td/Tt•100 | Quantitative Value (Turbidity) |
| 0 | 0.004 | -0.05 |
| 0.5 | 0.389 | 0.50 |
| 1 | 0.726 | 0.98 |
| 2 | 1.435 | 1.99 |
| 5 | 3.666 | 5.17 |
| 10 | 7.003 | 9.92 |
Keywords
UV-0014, V-630, V-650, UV-Visible/NIR, Chromaticity, Turbidity, LSE-701 Long pathlength cell holder, VWWQ-789 Chromaticity/turbidity measurement program, ISV-722/ISNN-723 Integrating sphere