Quantum Yield Measurement of the Up-Conversion Phosphors
May 1, 2024
 Download This Application
Introduction
Quantum yield is very useful in determining the efficiency of multi-step up-conversion excitation process that results in fluorescence at shorter wavelengths than the excitation light (Figure 1). Molecules can be excited at longer wavelengths where light scattering and absorption do not occur. This is particularly useful for evaluating labels used for biological imaging, materials in infrared solar cells and development of inks for anti-counterfeiting.
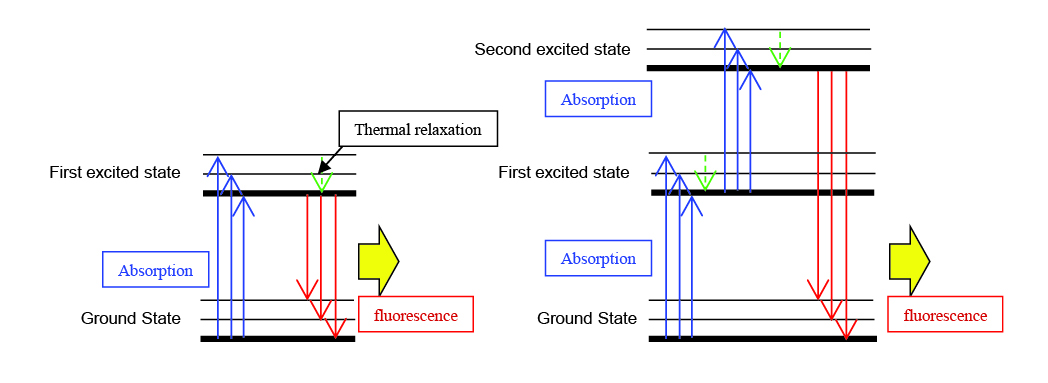
Up-conversion fluorescence intensity is proportional to the n -th power of the excitation intensity, where n is the number of excitation photons. When using up-conversion to analyze the excitation processes of materials it is therefore of interest to determine the up-conversion quantum yield.
Since the quantum yield of up-conversion materials is very low, a measurement system with high sensitivity is required. JASCO has developed an up-conversion quantum yield measurement system that can detect very small fluorescence intensities with the use of laser excitation.
This application note reports the up-conversion quantum yield measurement of phosphors with heavy rare earth elements.
Experimental
Measurement Conditions
| Emission Bandwidth | 5 nm | Data Acquisition Interval | 0.2 nm |
| Response Time | 0.2 sec | Scan Speed | 1000 nm/min |
| Laser Wavelength | 980 nm | Laser Output | 150 mW |
Solutions of tryptophan (0.0175 mg/L), humic acid (0.5 mg/L) and folic acid (1mg/L) were prepared in the following mixture ratios (tryptophan: humic acid: folic acid): 6:2:2, 5:5:0, 5:0:5, 4:4:2, 4:2:4, 2:6:2, 2:4:4, 2:2:6, 0:5:5.
Keywords
190-FP-0014, FP-8700, Fluorescence, up-conversion, quantum yield, near-infrared, NIR phosphors, quantum efficiency, biological dyes, FP0014
Results
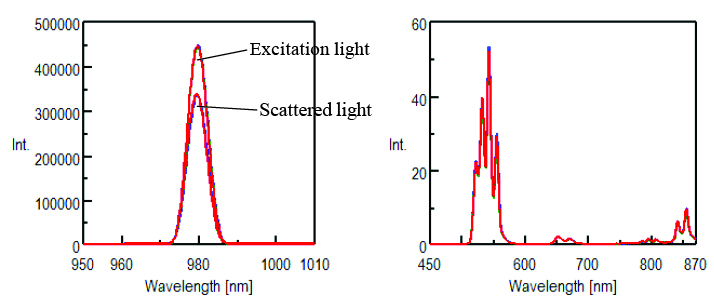
The excitation and fluorescence spectra of 6 samples were measured (YTa7O19: Er10, Yb40, YTa7O19: Ho4, Yb60, YTa7O19: Tm3, Yb80, RETa7O19: Er90, Tm10, GdTa7O19: Er10, Yb40, and Gd2O3: Er5, Yb10). Each sample was measured three times to evaluate the measurement reproducibility. The three measurements are overlaid and shown in different colors in Figures 3-8.
Tables 1- 6 show the quantum yield measurement results.
Table 1. Internal quantum yield measurement results of YTa7O19: Er10, Yb40.
| Measurement | Area of Excitation Light | Area of Scattered Light | Area of Absorption | Area of Fluorescence | Sample Absorbance (%) | Internal Quantum Yield (%) |
| 1 | 2.8 x 10⁶ | 2.14 x 10⁶ | 663270 | 1453.86 | 23.69 | 0.22 |
| 2 | 2.73 x 10⁶ | 2.14 x 10⁶ | 587840 | 1378.84 | 21.57 | 0.23 |
| 3 | 2.83 x 10⁶ | 2.14 x 10⁶ | 687620 | 1433.8 | 24.28 | 0.21 |
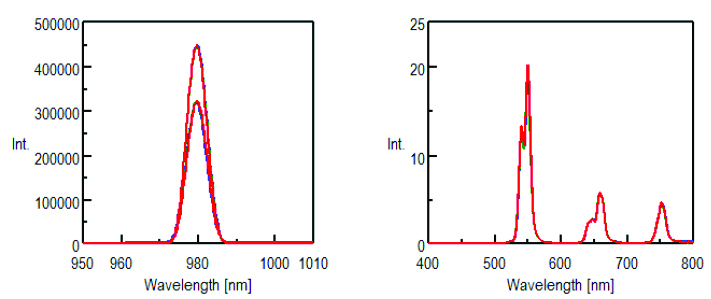
Table 2. Internal quantum yield measurement results of YTa7O19: Ho4, Yb60.
| Measurement | Area of Excitation Light | Area of Scattered Light | Area of Absorption | Area of Fluorescence | Sample Absorbance (%) | Internal Quantum Yield (%) |
| 1 | 2.75 x 10⁶ | 2.07 x 10⁶ | 685000 | 501.572 | 24.88 | 0.073 |
| 2 | 2.80 x 10⁶ | 2.09 x 10⁶ | 708860 | 498.81 | 25.32 | 0.070 |
| 3 | 2.87 x 10⁶ | 2.05 x 10⁶ | 821920 | 515.899 | 28.59 | 0.063 |
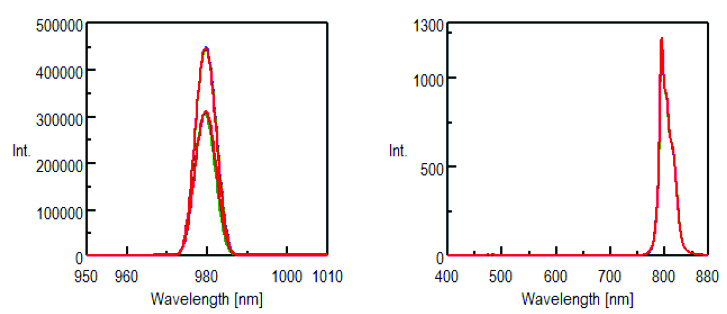
Table 3. Internal quantum yield measurement results of YTa7O19: Tm3, Yb80.
| Measurement | Area of Excitation Light | Area of Scattered Light | Area of Absorption | Area of Fluorescence | Sample Absorbance (%) | Internal Quantum Yield (%) |
| 1 | 2.75 x 10⁶ | 1.92 x 10⁶ | 833340 | 31500.1 | 30.32 | 3.78 |
| 2 | 2.75 x 10⁶ | 1.91 x 10⁶ | 845170 | 32176.7 | 30.73 | 3.81 |
| 3 | 2.77 x 10⁶ | 1.95 x 10⁶ | 819330 | 31277.2 | 29.55 | 3.82 |
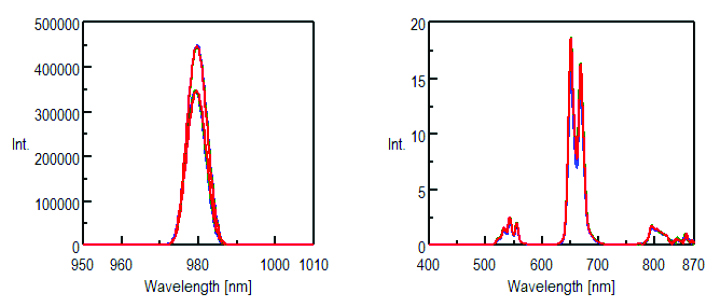
Table 4. Internal quantum yield measurement results of RETa7O19: Er90, Tm10.
| Measurement | Area of Excitation Light | Area of Scattered Light | Area of Absorption | Area of Fluorescence | Sample Absorbance (%) | Internal Quantum Yield (%) |
| 1 | 2.74 x 10⁶ | 2.14 x 10⁶ | 594410 | 501.341 | 21.71 | 0.084 |
| 2 | 2.86 x 10⁶ | 2.16 x 10⁶ | 698340 | 446.071 | 24.44 | 0.064 |
| 3 | 2.76 x 10⁶ | 2.14 x 10⁶ | 620210 | 566.941 | 22.45 | 0.091 |
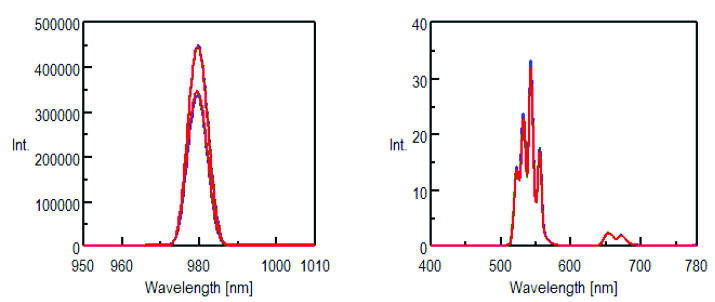
Table 5. Internal quantum yield measurement results of GdTa7O19: Er10, Yb40.
| Measurement | Area of Excitation Light | Area of Scattered Light | Area of Absorption | Area of Fluorescence | Sample Absorbance (%) | Internal Quantum Yield (%) |
| 1 | 2.74 x 10⁶ | 2.08 x 10⁶ | 663190 | 908.777 | 24.22 | 0.14 |
| 2 | 2.83 x 10⁶ | 2.16 x 10⁶ | 664660 | 863.496 | 23.51 | 0.13 |
| 3 | 2.85 x 10⁶ | 2.20 x 10⁶ | 654600 | 843.468 | 22.97 | 0.13 |
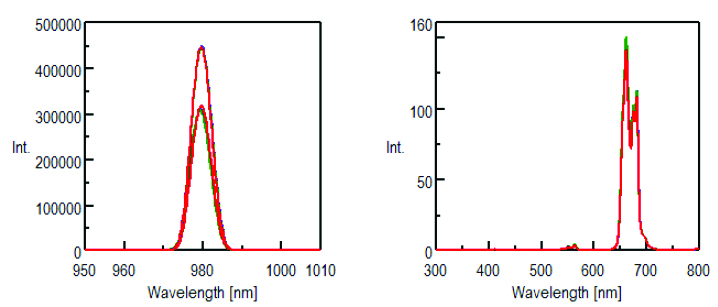
Table 6. Internal quantum yield measurement results of Gd2O3: Er5, Yb10.
Conclusion
With the exception of the YTa7O19: Tm3, Yb80 complex (Figure 6, Table 3), these results demonstrate that the up-conversion system can evaluate quantum yields at levels of less than 1%.
Required Products and Software
- FP-8700 Spectrofluorometer
- ESC-842 Calibrated WI Light Source
Featured Products:
-
Sophisticated optical system offering the ultimate in sensitivity, spectral accuracy, and flexibility for the most challenging materials and biological samples.
FP-8550 Spectrofluorometer
-
Uniquely optimized for NIR applications with extended wavelength measurement to 1010 nm.
FP-8650 NIR Spectrofluorometer

Quantum Yield Measurement of the Up-Conversion Phosphors
Introduction
Quantum yield is very useful in determining the efficiency of multi-step up-conversion excitation process that results in fluorescence at shorter wavelengths than the excitation light (Figure 1). Molecules can be excited at longer wavelengths where light scattering and absorption do not occur. This is particularly useful for evaluating labels used for biological imaging, materials in infrared solar cells and development of inks for anti-counterfeiting.
Up-conversion fluorescence intensity is proportional to the n -th power of the excitation intensity, where n is the number of excitation photons. When using up-conversion to analyze the excitation processes of materials it is therefore of interest to determine the up-conversion quantum yield.
Since the quantum yield of up-conversion materials is very low, a measurement system with high sensitivity is required. JASCO has developed an up-conversion quantum yield measurement system that can detect very small fluorescence intensities with the use of laser excitation.
This application note reports the up-conversion quantum yield measurement of phosphors with heavy rare earth elements.
Experimental
Measurement Conditions
| Emission Bandwidth | 5 nm | Data Acquisition Interval | 0.2 nm |
| Response Time | 0.2 sec | Scan Speed | 1000 nm/min |
| Laser Wavelength | 980 nm | Laser Output | 150 mW |
Solutions of tryptophan (0.0175 mg/L), humic acid (0.5 mg/L) and folic acid (1mg/L) were prepared in the following mixture ratios (tryptophan: humic acid: folic acid): 6:2:2, 5:5:0, 5:0:5, 4:4:2, 4:2:4, 2:6:2, 2:4:4, 2:2:6, 0:5:5.
Results
The excitation and fluorescence spectra of 6 samples were measured (YTa7O19: Er10, Yb40, YTa7O19: Ho4, Yb60, YTa7O19: Tm3, Yb80, RETa7O19: Er90, Tm10, GdTa7O19: Er10, Yb40, and Gd2O3: Er5, Yb10). Each sample was measured three times to evaluate the measurement reproducibility. The three measurements are overlaid and shown in different colors in Figures 3-8.
Tables 1- 6 show the quantum yield measurement results.
Table 1. Internal quantum yield measurement results of YTa7O19: Er10, Yb40.
| Measurement | Area of Excitation Light | Area of Scattered Light | Area of Absorption | Area of Fluorescence | Sample Absorbance (%) | Internal Quantum Yield (%) |
| 1 | 2.8 x 10⁶ | 2.14 x 10⁶ | 663270 | 1453.86 | 23.69 | 0.22 |
| 2 | 2.73 x 10⁶ | 2.14 x 10⁶ | 587840 | 1378.84 | 21.57 | 0.23 |
| 3 | 2.83 x 10⁶ | 2.14 x 10⁶ | 687620 | 1433.8 | 24.28 | 0.21 |
Table 2. Internal quantum yield measurement results of YTa7O19: Ho4, Yb60.
| Measurement | Area of Excitation Light | Area of Scattered Light | Area of Absorption | Area of Fluorescence | Sample Absorbance (%) | Internal Quantum Yield (%) |
| 1 | 2.75 x 10⁶ | 2.07 x 10⁶ | 685000 | 501.572 | 24.88 | 0.073 |
| 2 | 2.80 x 10⁶ | 2.09 x 10⁶ | 708860 | 498.81 | 25.32 | 0.070 |
| 3 | 2.87 x 10⁶ | 2.05 x 10⁶ | 821920 | 515.899 | 28.59 | 0.063 |
Table 3. Internal quantum yield measurement results of YTa7O19: Tm3, Yb80.
| Measurement | Area of Excitation Light | Area of Scattered Light | Area of Absorption | Area of Fluorescence | Sample Absorbance (%) | Internal Quantum Yield (%) |
| 1 | 2.75 x 10⁶ | 1.92 x 10⁶ | 833340 | 31500.1 | 30.32 | 3.78 |
| 2 | 2.75 x 10⁶ | 1.91 x 10⁶ | 845170 | 32176.7 | 30.73 | 3.81 |
| 3 | 2.77 x 10⁶ | 1.95 x 10⁶ | 819330 | 31277.2 | 29.55 | 3.82 |
Table 4. Internal quantum yield measurement results of RETa7O19: Er90, Tm10.
| Measurement | Area of Excitation Light | Area of Scattered Light | Area of Absorption | Area of Fluorescence | Sample Absorbance (%) | Internal Quantum Yield (%) |
| 1 | 2.74 x 10⁶ | 2.14 x 10⁶ | 594410 | 501.341 | 21.71 | 0.084 |
| 2 | 2.86 x 10⁶ | 2.16 x 10⁶ | 698340 | 446.071 | 24.44 | 0.064 |
| 3 | 2.76 x 10⁶ | 2.14 x 10⁶ | 620210 | 566.941 | 22.45 | 0.091 |
Table 5. Internal quantum yield measurement results of GdTa7O19: Er10, Yb40.
| Measurement | Area of Excitation Light | Area of Scattered Light | Area of Absorption | Area of Fluorescence | Sample Absorbance (%) | Internal Quantum Yield (%) |
| 1 | 2.74 x 10⁶ | 2.08 x 10⁶ | 663190 | 908.777 | 24.22 | 0.14 |
| 2 | 2.83 x 10⁶ | 2.16 x 10⁶ | 664660 | 863.496 | 23.51 | 0.13 |
| 3 | 2.85 x 10⁶ | 2.20 x 10⁶ | 654600 | 843.468 | 22.97 | 0.13 |
Table 6. Internal quantum yield measurement results of Gd2O3: Er5, Yb10.
Conclusion
With the exception of the YTa7O19: Tm3, Yb80 complex (Figure 6, Table 3), these results demonstrate that the up-conversion system can evaluate quantum yields at levels of less than 1%.
Keywords
190-FP-0014, FP-8700, Fluorescence, up-conversion, quantum yield, near-infrared, NIR phosphors, quantum efficiency, biological dyes, FP0014
Required Products and Software
- FP-8700 Spectrofluorometer
- ESC-842 Calibrated WI Light Source