Raman measurement of surface iron oxidation states
January 5, 2024
 Download This Application
Introduction
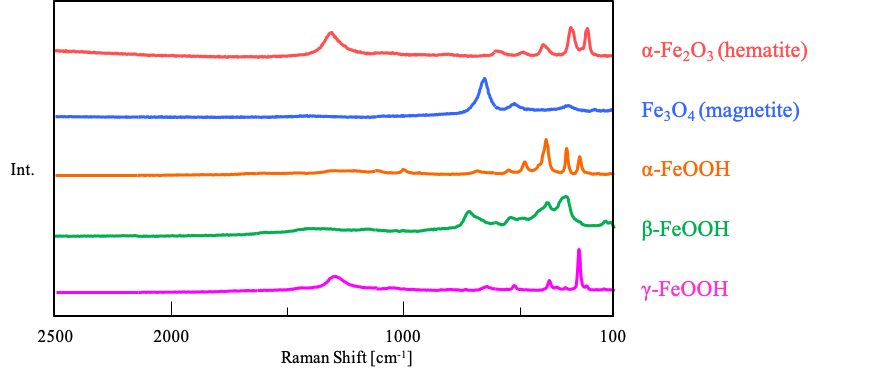
Rust that occurs when iron materials corrode has various oxidation states and crystal structures, such as Fe2O3, Fe3O4, and FeOOH, resulting in differences in Raman spectra (Figure 1). Since the type of rust that occurs depends on the exposure environment, analysis of the oxidation state of the rust can lead to the elucidation of the causes of corrosion, and the necessary steps to prevent it. In this note, we introduce the results of the analysis of oxidation states on the surface of iron materials using a micro Raman spectrometer.
Experimental
Samples: Two samples* taken from different environments (indoor and outdoor) were analyzed.
*Details of the environment in which the samplers were previously exposed, both indoors and outdoors at the time of sampling are unknown.
Measurement procedure and results:
1. Point measurements for each rust sample
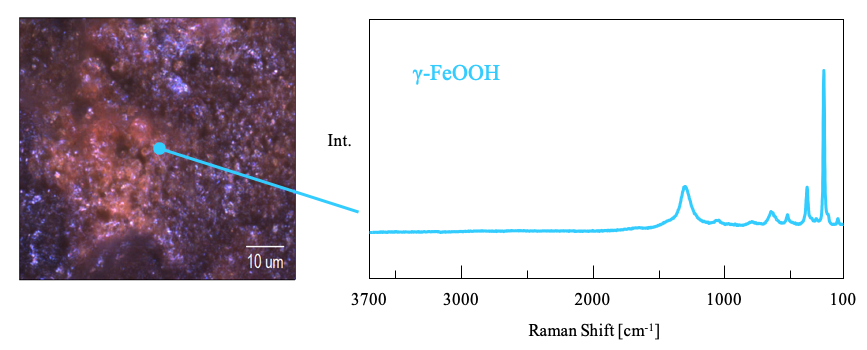
Multiple spectra from different oxidation states such as α-Fe2O3 and Fe3O4 were obtained from samples collected indoors, with γ-FeOOH being mostly detected from samples collected from outdoor samples (Figure 2).
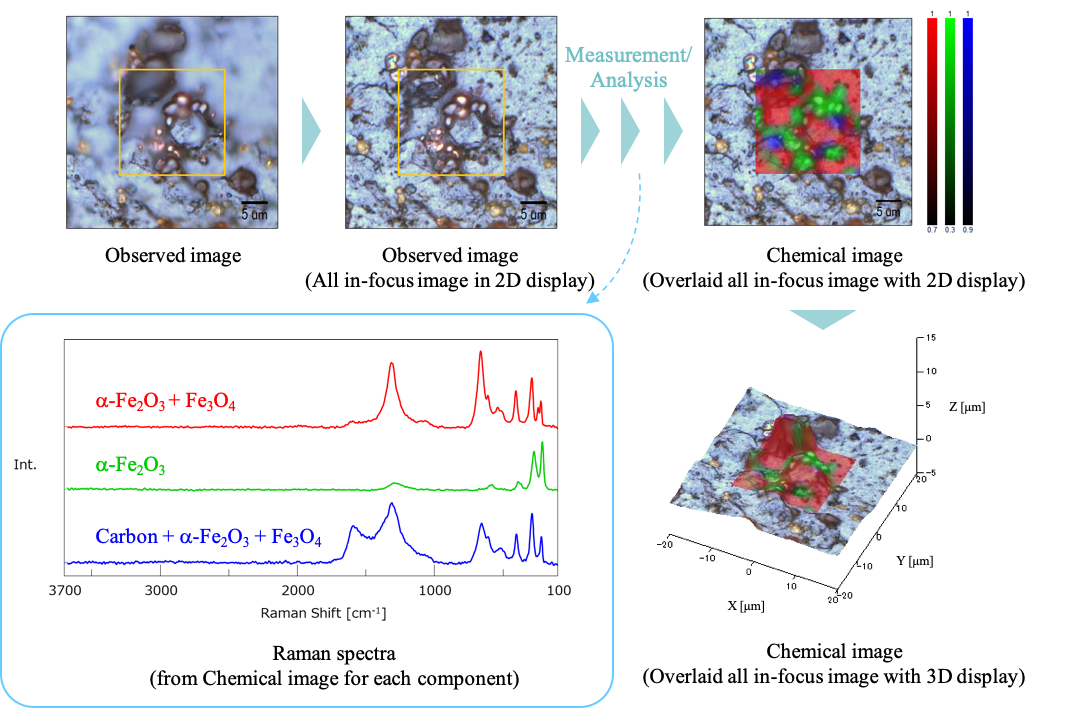
2. Imaging measurement of samples collected indoors (evaluation of component distribution)
Three different spectra were obtained. Here, the typical spectrum of each component was used as the reference spectrum (the spectra are shown in Figure 4), and a chemical image was created using the correlation (similarity) with the reference spectrum. Using a false-color map to create a chemical image, it is possible to visualize the component distribution that may be difficult to determine visually, which is thought useful for analyzing the cause of corrosion.
Parameters for imaging and point measurement
Since the surface of rusted metal has a lot of irregularities, Surface Scan Imaging (SSI) was used for imaging measurement along the irregularities. (Reference: Application Note 260-AN-0017). SSI has the ability to quickly image and map rough or uneven samples.
| Main Unit: NRS-5500 Raman Spectrometer | |||
| Ex wavelength | 532 nm | Data interval | 2 µm |
| Exposure time | 15 seconds | Accumulation | 1 time |
| Objective lens | 100x, long work distance for dark field observation | ||
Keywords
170-AN-0021
Results
Using Raman spectroscopy it is possible to analyze the oxidation state and crystal structure of inorganic substances, such as rust. In addition, SSI is a very effective tool for imaging measurement of samples with an uneven surface such as rust.
| System Configuration | ||||
| Model | Description | P/N | Remarks | |
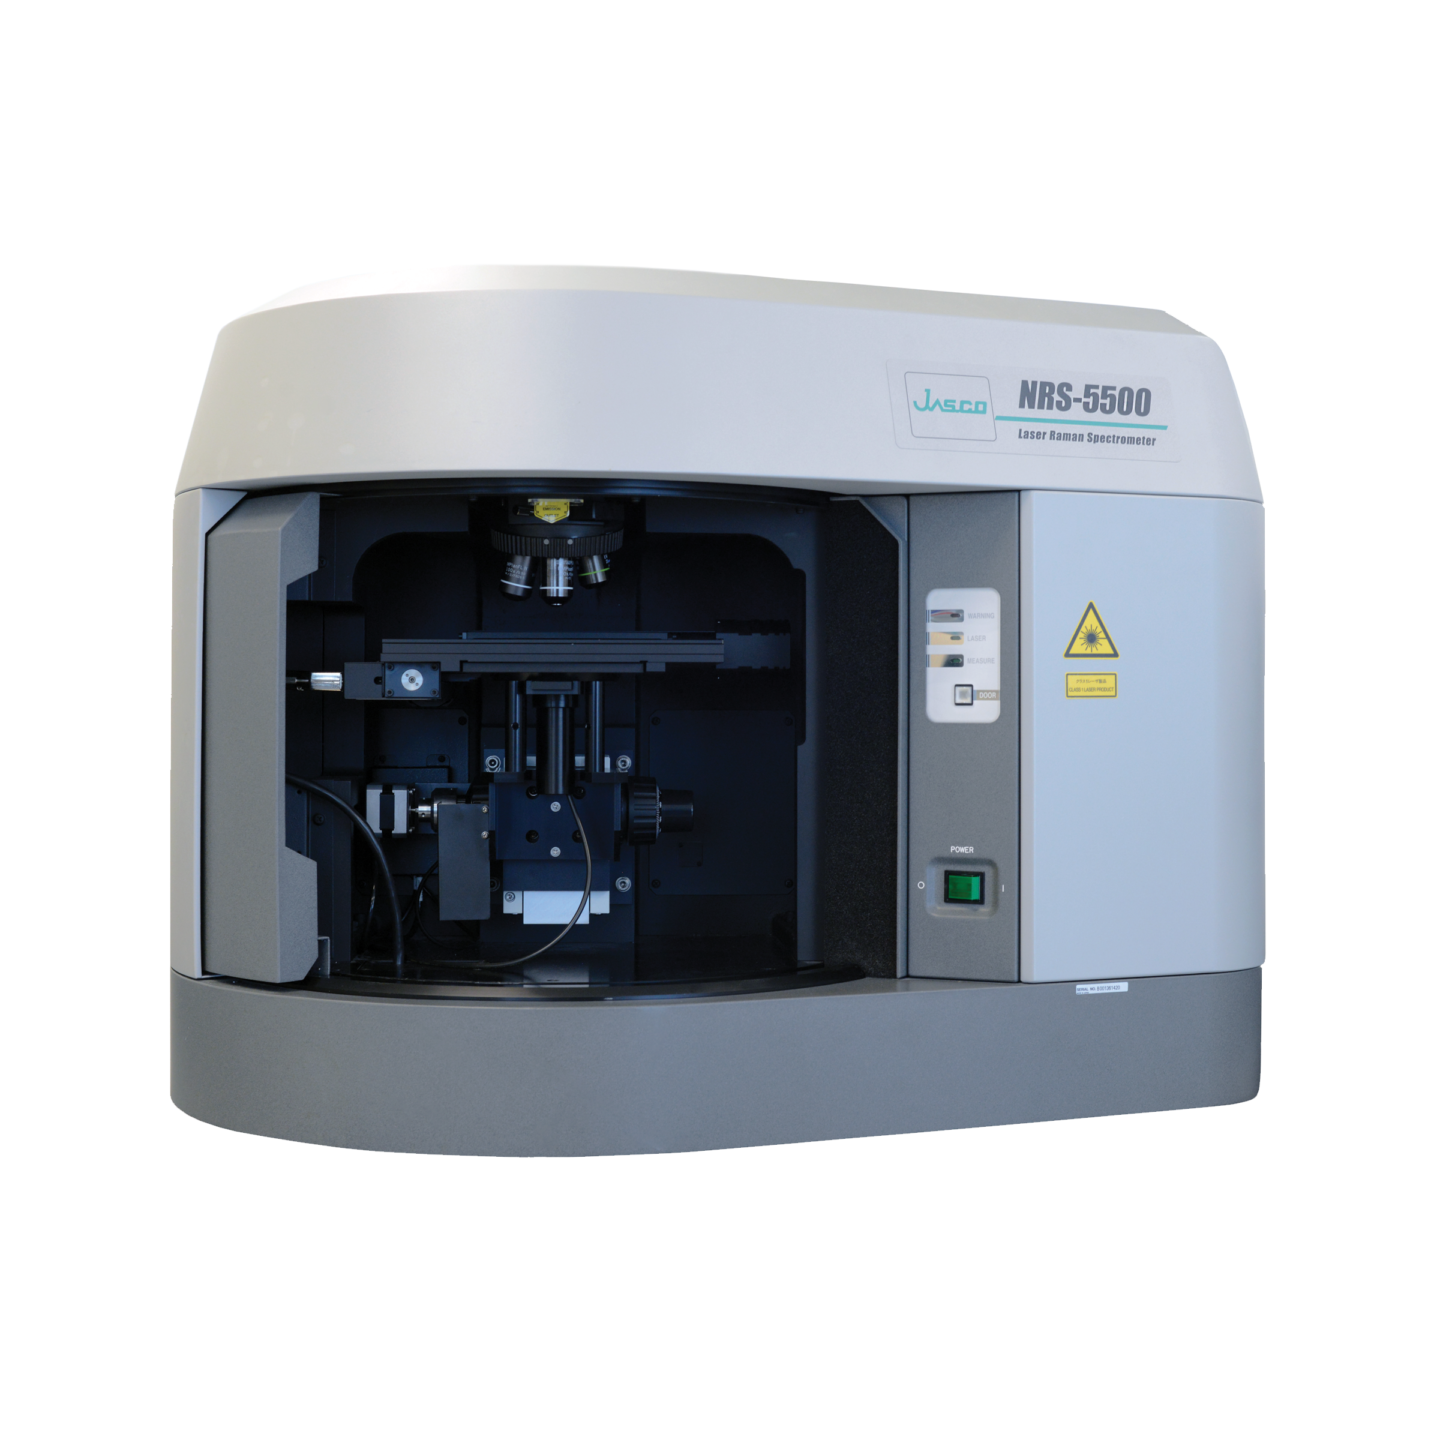
| Main Unit | NRS-5500 | Raman Spectrometer | 7119-J051A | 532 nm laser 100 mW laser was used, but a standard 50 mW is also available. |
| Options | RXY-57 | Automatic XYZ stage | 6947-J478B | |
| SSI-457 | Surface Scan Imaging | 7118-J378A | ||
| RHG5-600B500 | 600 gr/mm grating | 6947-J293A | ||
| RMIX57 | MIX observation unit | 7119-J255A | For dark observation and MIX observation *1 | |
| LMPLFLN100xBD | Objective lens for dark field observation, x100, long work distance, for Vis range | 1052-0196 | Choose the lens according to the sample. | |
*1 MIX observation is useful for colored samples.
Note: this is a factory option, field upgrade is not possible.
An objective lens for dark observation is also required.
<About the measurement of Figure 4>
• Measurement time, approx.30 minutes.To avoid changing the rust condition, weaken the laser intensity and increase the exposure time, it takes a little longer for wide-range imaging.
• If the surface roughness is not significant, the standard imaging function can be used instead of SSI.
Featured Products:

Raman measurement of surface iron oxidation states
Introduction
Rust that occurs when iron materials corrode has various oxidation states and crystal structures, such as Fe2O3, Fe3O4, and FeOOH, resulting in differences in Raman spectra (Figure 1). Since the type of rust that occurs depends on the exposure environment, analysis of the oxidation state of the rust can lead to the elucidation of the causes of corrosion, and the necessary steps to prevent it. In this note, we introduce the results of the analysis of oxidation states on the surface of iron materials using a micro Raman spectrometer.
Experimental
Samples: Two samples* taken from different environments (indoor and outdoor) were analyzed.
*Details of the environment in which the samplers were previously exposed, both indoors and outdoors at the time of sampling are unknown.
Measurement procedure and results:
1. Point measurements for each rust sample
Multiple spectra from different oxidation states such as α-Fe2O3 and Fe3O4 were obtained from samples collected indoors, with γ-FeOOH being mostly detected from samples collected from outdoor samples (Figure 2).
2. Imaging measurement of samples collected indoors (evaluation of component distribution)
Three different spectra were obtained. Here, the typical spectrum of each component was used as the reference spectrum (the spectra are shown in Figure 4), and a chemical image was created using the correlation (similarity) with the reference spectrum. Using a false-color map to create a chemical image, it is possible to visualize the component distribution that may be difficult to determine visually, which is thought useful for analyzing the cause of corrosion.
Parameters for imaging and point measurement
Since the surface of rusted metal has a lot of irregularities, Surface Scan Imaging (SSI) was used for imaging measurement along the irregularities. (Reference: Application Note 260-AN-0017). SSI has the ability to quickly image and map rough or uneven samples.
| Main Unit: NRS-5500 Raman Spectrometer | |||
| Ex wavelength | 532 nm | Data interval | 2 µm |
| Exposure time | 15 seconds | Accumulation | 1 time |
| Objective lens | 100x, long work distance for dark field observation | ||
Results
Using Raman spectroscopy it is possible to analyze the oxidation state and crystal structure of inorganic substances, such as rust. In addition, SSI is a very effective tool for imaging measurement of samples with an uneven surface such as rust.
| System Configuration | ||||
| Model | Description | P/N | Remarks | |
| Main Unit | NRS-5500 | Raman Spectrometer | 7119-J051A | 532 nm laser 100 mW laser was used, but a standard 50 mW is also available. |
| Options | RXY-57 | Automatic XYZ stage | 6947-J478B | |
| SSI-457 | Surface Scan Imaging | 7118-J378A | ||
| RHG5-600B500 | 600 gr/mm grating | 6947-J293A | ||
| RMIX57 | MIX observation unit | 7119-J255A | For dark observation and MIX observation *1 | |
| LMPLFLN100xBD | Objective lens for dark field observation, x100, long work distance, for Vis range | 1052-0196 | Choose the lens according to the sample. | |
*1 MIX observation is useful for colored samples.
Note: this is a factory option, field upgrade is not possible.
An objective lens for dark observation is also required.
<About the measurement of Figure 4>
• Measurement time, approx.30 minutes.To avoid changing the rust condition, weaken the laser intensity and increase the exposure time, it takes a little longer for wide-range imaging.
• If the surface roughness is not significant, the standard imaging function can be used instead of SSI.
Keywords
170-AN-0021