Raman Quantitative Calibration Stability for a Sample Mixture
August 25, 2022
 Download This Application
Introduction
Recent advances in technology for Raman spectroscopy has resulted in a wealth of applications. Raman spectroscopy is ideal for routine sample quantitative analysis due to the lack of sample preparation, the ability to use various sample containers and the rapid speed of spectral collection.
The use of Raman spectroscopy for routine quantitative analysis is desirable due to the simple sample handling requirements for sample analysis. Due to the many variables associated with Raman spectroscopy, specifically, laser power, Raman cross-section, wavelength and intensity stability, Raman is rarely used for quantitative analysis. Compared to Raman analysis, there are other methods that can provide a repeatable quantitative prediction of unknowns, but these methods can require extensive sample preparation or extended time for analysis. To demonstrate the capabilities of Raman spectroscopy for quantitative analysis, a 2 component mixture of liquid samples was analyzed using a Raman spectrometer and the results reported.
Experimental
Several mixtures of benzonitrile dissolved in ethanol were prepared at 0.1, 0.3, 0.5, 1.0, 3.0 and 5.0% concentration as standards for development of the multi-component calibration model including a 0.2% mixture to be used as an ‘unknown’ for analysis using the calibration model. A Jasco NRS-3100 Raman spectrometer was used to collect triplicate spectra of the standards using 532 nm excitation and a 60 second integration of the CCD with 2 accumulations to obtain spectra with a spectral resolution of slightly less than 4 cm -1 resolution. Samples were contained within 2 mL HPLC sample vials and a macro accessory used for excitation/collection of the sample volumes. No further correction of the Raman spectra was performed prior to development of the calibration model or analysis of ‘unknown’ spectra.
Results
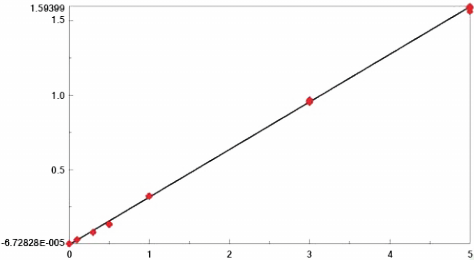
The various standard spectra as well as an ethanol ‘blank’ were used to develop the quantitative calibration model using Jasco’s Spectra Manager Quantitative Analysis package. A peak ratio method using the 2234 cm -1 C-N stretch of benzonitrile vs. the 1455 cm -1 C-H bend of the ethanol was used for the development of the linear calibration curve. Preliminary calibration results based on the initial triplicate spectra of each standard provided a calibration curve with a fit of 0.9998 and an R 2 of 0.9996, indicating an excellent fit of the data. To evaluate the repeatability of the calibration method, additional spectral data sets of all standards were collected again after 1 and 2 weeks, providing a total of at least nine spectra of each standard for calculation of the calibration curve. The final calibration curve also provided a linear calibration curve with very little scatter, offering a fit of 0.9997 and an R 2 (residual) of 0.9995 (Figure 1). As well, the analysis of the ‘unknown’ sample that was prepared indicated errors of less than 0.5% for the replicate analyses conducted over the 2 week period.
Conclusion
The results demonstrate that a reliable calibration model can be developed from Raman spectra of a mixture without further correction. The results demonstrate a correlation of 0.999 or better for the quantitative component over a range of concentrations from approximately 0.1 to 5%. Further, the Raman method provides repeatable, reproducible results and proves to be stable for extended periods.
Featured Products:

Raman Quantitative Calibration Stability for a Sample Mixture
Introduction
Recent advances in technology for Raman spectroscopy has resulted in a wealth of applications. Raman spectroscopy is ideal for routine sample quantitative analysis due to the lack of sample preparation, the ability to use various sample containers and the rapid speed of spectral collection.
The use of Raman spectroscopy for routine quantitative analysis is desirable due to the simple sample handling requirements for sample analysis. Due to the many variables associated with Raman spectroscopy, specifically, laser power, Raman cross-section, wavelength and intensity stability, Raman is rarely used for quantitative analysis. Compared to Raman analysis, there are other methods that can provide a repeatable quantitative prediction of unknowns, but these methods can require extensive sample preparation or extended time for analysis. To demonstrate the capabilities of Raman spectroscopy for quantitative analysis, a 2 component mixture of liquid samples was analyzed using a Raman spectrometer and the results reported.
Experimental
Several mixtures of benzonitrile dissolved in ethanol were prepared at 0.1, 0.3, 0.5, 1.0, 3.0 and 5.0% concentration as standards for development of the multi-component calibration model including a 0.2% mixture to be used as an ‘unknown’ for analysis using the calibration model. A Jasco NRS-3100 Raman spectrometer was used to collect triplicate spectra of the standards using 532 nm excitation and a 60 second integration of the CCD with 2 accumulations to obtain spectra with a spectral resolution of slightly less than 4 cm -1 resolution. Samples were contained within 2 mL HPLC sample vials and a macro accessory used for excitation/collection of the sample volumes. No further correction of the Raman spectra was performed prior to development of the calibration model or analysis of ‘unknown’ spectra.
Results
The various standard spectra as well as an ethanol ‘blank’ were used to develop the quantitative calibration model using Jasco’s Spectra Manager Quantitative Analysis package. A peak ratio method using the 2234 cm -1 C-N stretch of benzonitrile vs. the 1455 cm -1 C-H bend of the ethanol was used for the development of the linear calibration curve. Preliminary calibration results based on the initial triplicate spectra of each standard provided a calibration curve with a fit of 0.9998 and an R 2 of 0.9996, indicating an excellent fit of the data. To evaluate the repeatability of the calibration method, additional spectral data sets of all standards were collected again after 1 and 2 weeks, providing a total of at least nine spectra of each standard for calculation of the calibration curve. The final calibration curve also provided a linear calibration curve with very little scatter, offering a fit of 0.9997 and an R 2 (residual) of 0.9995 (Figure 1). As well, the analysis of the ‘unknown’ sample that was prepared indicated errors of less than 0.5% for the replicate analyses conducted over the 2 week period.
Conclusion
The results demonstrate that a reliable calibration model can be developed from Raman spectra of a mixture without further correction. The results demonstrate a correlation of 0.999 or better for the quantitative component over a range of concentrations from approximately 0.1 to 5%. Further, the Raman method provides repeatable, reproducible results and proves to be stable for extended periods.