Rapid FTIR Quantitative Analysis of Trans-Fatty Acid at Extremely Low Concentrations using a Liquid Cell
April 25, 2024
 Download This Application
Introduction
Trans-fatty acids in food are becoming a major concern due to their detrimental affects on human health. A method for the rapid quantitative analysis using FTIR with temperature controlled ATR has been suggested1,2) and an official method using FTIR has been proposed by both the AOAC (American Organization of Analytical Chemists) and AOCS (American Oil Chemists’ Society) due to its extremely short analysis time, within 1–2 minutes, which is much shorter than that required by a GC method (Gas Chromatography, which also requires extensive sample preparation). The official method described by the AOCS, suggest that the limit of quantitation (LOQ) using the ATR method is around 1.0%2), this was also demonstrated in our FTIR Application data1) under the same experimental conditions specified by the AOCS.
According to “The Guideline for Disclosure of Information on Trans-fatty acid Content” issued by the Consumer Affairs Agency of Japan, “Zero” may be shown on the labeling if the measured content of trans-fatty acid in food is less than 0.3% w/w or 0.3% w/v (for beverages). In other words, 0.3% is the required limit of quantitation (LOQ). Similar requirements are found in other countries (USA: < 0.5 g / meal, Taiwan: < 0.3 g / 100 g, Korea or South America: < 0.2 g / meal) and accordingly, a rapid and precise method is required for the quantitative analysis of trans-fatty acid content in food to limits below 1.0%. The method for quantitation of trans-fatty acid described in the Guideline uses GC (AOCS Ce1h-05 or AOAC996.06), or other methods that have the equivalent performance to this method. The analysis using GC not only requires extensive sample preparation before measurement, including removal of methylated fat using BF3, but also requires more than 1 hour for the separation. This report describes the quantitative analysis of trans-fatty acids to levels below 1.0% using an FTIR transmission method, demonstrating an equivalent result to the GC method and can be obtained in an extremely short time.
Experimental
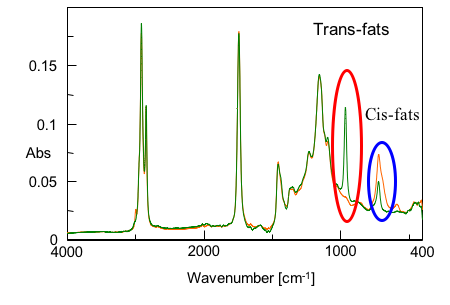
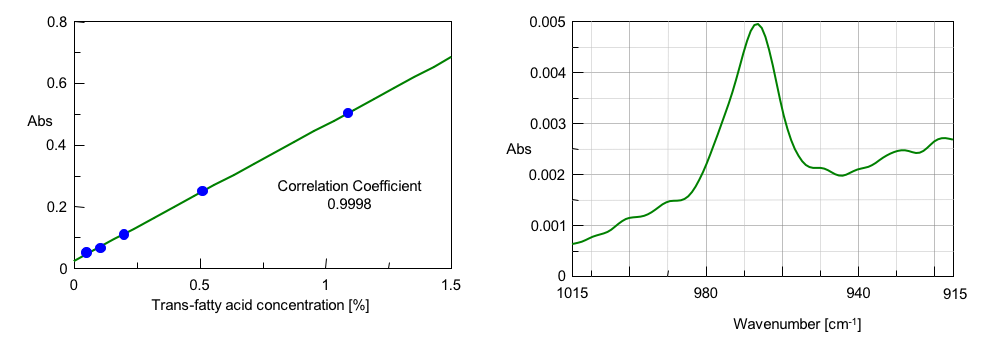
The trans-fatty acid peak at 966 cm-1 is used for the quantitative analysis (Fig. 1). This is also adopted in the official methods, such as the ATR method2).
A calibration curve was created with 5 standard levels of trielaidin, which were prepared by adding trielaidin (green color spectrum in Fig. 1), an isomer of trans-triolein, to cis-triolein (orange color spectrum in Fig. 1) which contains only cis-type.
| Measurement Conditions | |||
| Instrument | |||
| Detector | DLaTGS | Resolution | 4 cm-1 |
| Accumulation | 64 times | Apodization | Triangle |
| Temperature | 25°C (ambient temperature) | ||
| Mode | Transmission (method of solution) | ||
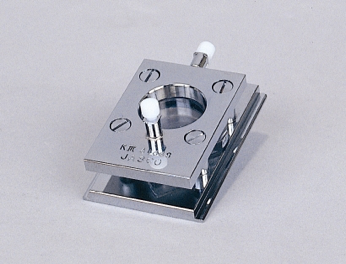
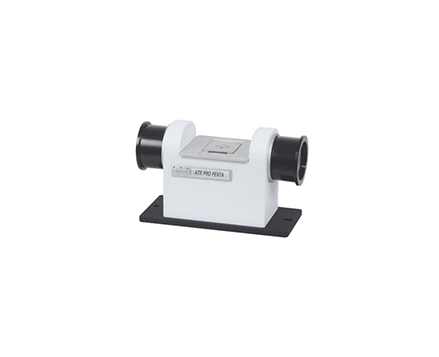
| Cell | Sealed liquid cell *NaCl (thickness : 0.1 mm) | ||
| Standard Sample | Triolein, Trielaidin (0.05, 0.1, 0.2, 0.5, 1.0%) | ||
| Peak Calculation | Area 945 - 990 cm-1 | ||
| * A sealed liquid cell with KBr windows can be also used. Please contact local JASCO distributor if the cell needs to be thermostatted. |
|||
Keywords
050-QU-0232, trans fatty acids, trans fats, FTIR, transmission, ATR, LDL, HDL, cholesterol
Results
Transmission spectra of 5 standard levels of trielaidin (0.05, 0.1, 0.2, 0.5, 1.0%) are displayed in Fig. 3. The correlation coefficient (0.9998) for the calibration curve shows a good linearity for the trans-fatty acid concentration using the peak height or area around 966 cm-1 (Fig. 4). Since the S/N (Peak-to-Peak) for the standard level at 0.05% is about 15:1, which is much better than the required 10:1 normally accepted as the limit of quantitation (LOQ) (Fig. 5), this method is considered sensitive enough for the quantitative analysis of samples with low concentrations, down to 0.05%.
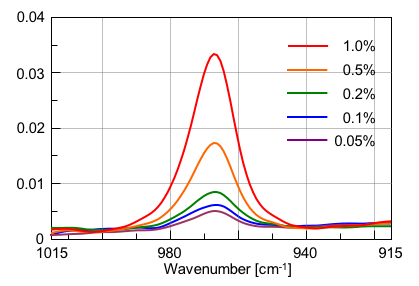
The result shown indicates that the quantitative analysis of 0.05 – 1.0% trans-fatty acid can be achieved using FTIR transmission measurement. This method has the distinct advantages of little or no sample preparation and is much faster compared with the GC method. However, the cell has to be washed between measurements, making it a little less convenient than the ATR method. Therefore, we recommend that the ATR method is used for measurement to LOQs of 1% and the transmission method is used for sample measurement to LOQs below 1.0%.
1) JASCO FT/IR Application data 050-AT-0215 (2010)
2) AOAC Official Method 2000.10, AOCS Official Method Cd 14d-99
Featured Products:


Rapid FTIR Quantitative Analysis of Trans-Fatty Acid at Extremely Low Concentrations using a Liquid Cell
Introduction
Trans-fatty acids in food are becoming a major concern due to their detrimental affects on human health. A method for the rapid quantitative analysis using FTIR with temperature controlled ATR has been suggested1,2) and an official method using FTIR has been proposed by both the AOAC (American Organization of Analytical Chemists) and AOCS (American Oil Chemists’ Society) due to its extremely short analysis time, within 1–2 minutes, which is much shorter than that required by a GC method (Gas Chromatography, which also requires extensive sample preparation). The official method described by the AOCS, suggest that the limit of quantitation (LOQ) using the ATR method is around 1.0%2), this was also demonstrated in our FTIR Application data1) under the same experimental conditions specified by the AOCS.
According to “The Guideline for Disclosure of Information on Trans-fatty acid Content” issued by the Consumer Affairs Agency of Japan, “Zero” may be shown on the labeling if the measured content of trans-fatty acid in food is less than 0.3% w/w or 0.3% w/v (for beverages). In other words, 0.3% is the required limit of quantitation (LOQ). Similar requirements are found in other countries (USA: < 0.5 g / meal, Taiwan: < 0.3 g / 100 g, Korea or South America: < 0.2 g / meal) and accordingly, a rapid and precise method is required for the quantitative analysis of trans-fatty acid content in food to limits below 1.0%. The method for quantitation of trans-fatty acid described in the Guideline uses GC (AOCS Ce1h-05 or AOAC996.06), or other methods that have the equivalent performance to this method. The analysis using GC not only requires extensive sample preparation before measurement, including removal of methylated fat using BF3, but also requires more than 1 hour for the separation. This report describes the quantitative analysis of trans-fatty acids to levels below 1.0% using an FTIR transmission method, demonstrating an equivalent result to the GC method and can be obtained in an extremely short time.
Experimental
The trans-fatty acid peak at 966 cm-1 is used for the quantitative analysis (Fig. 1). This is also adopted in the official methods, such as the ATR method2).
A calibration curve was created with 5 standard levels of trielaidin, which were prepared by adding trielaidin (green color spectrum in Fig. 1), an isomer of trans-triolein, to cis-triolein (orange color spectrum in Fig. 1) which contains only cis-type.
| Measurement Conditions | |||
| Instrument | |||
| Detector | DLaTGS | Resolution | 4 cm-1 |
| Accumulation | 64 times | Apodization | Triangle |
| Temperature | 25°C (ambient temperature) | ||
| Mode | Transmission (method of solution) | ||
| Cell | Sealed liquid cell *NaCl (thickness : 0.1 mm) | ||
| Standard Sample | Triolein, Trielaidin (0.05, 0.1, 0.2, 0.5, 1.0%) | ||
| Peak Calculation | Area 945 - 990 cm-1 | ||
| * A sealed liquid cell with KBr windows can be also used. Please contact local JASCO distributor if the cell needs to be thermostatted. |
|||
Results
Transmission spectra of 5 standard levels of trielaidin (0.05, 0.1, 0.2, 0.5, 1.0%) are displayed in Fig. 3. The correlation coefficient (0.9998) for the calibration curve shows a good linearity for the trans-fatty acid concentration using the peak height or area around 966 cm-1 (Fig. 4). Since the S/N (Peak-to-Peak) for the standard level at 0.05% is about 15:1, which is much better than the required 10:1 normally accepted as the limit of quantitation (LOQ) (Fig. 5), this method is considered sensitive enough for the quantitative analysis of samples with low concentrations, down to 0.05%.
The result shown indicates that the quantitative analysis of 0.05 – 1.0% trans-fatty acid can be achieved using FTIR transmission measurement. This method has the distinct advantages of little or no sample preparation and is much faster compared with the GC method. However, the cell has to be washed between measurements, making it a little less convenient than the ATR method. Therefore, we recommend that the ATR method is used for measurement to LOQs of 1% and the transmission method is used for sample measurement to LOQs below 1.0%.
1) JASCO FT/IR Application data 050-AT-0215 (2010)
2) AOAC Official Method 2000.10, AOCS Official Method Cd 14d-99
Keywords
050-QU-0232, trans fatty acids, trans fats, FTIR, transmission, ATR, LDL, HDL, cholesterol