Rapid Kinetic Measurement of 2,6-Dichloroindophenol using a UV-visible Absorption Stopped-Flow System
January 5, 2024
 Download This Application
Introduction
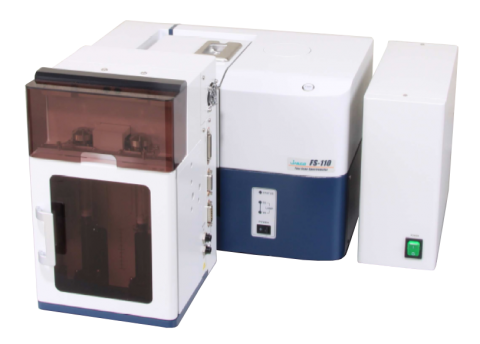
An absorption stopped-flow measurement system is designed to measure rapid enzymatic, catalytic, and oxidation/reduction reactions. The system consists of the FS-110 fast scan spectrophotometer and the SFS-822 stopped-flow accessory and allows from two to four liquid samples to be rapidly mixed. Stopped-flow absorption spectra can be measured in 5 msec intervals to acquire reactions occurring at millisecond timescales.
This application note illustrates how the absorption stopped-flow system can determine the reaction rate for the reduction of 2,6-dicholorindeophenol (DCIP), whose color in aqueous solution changes from to blue to colorless as a result of its reaction with L-ascorbic acid.
Experimental
| Measurement Conditions | |||
| Spectrophotometer | Stopped-Flow System | ||
| Optical Pathlength | 2 mm | Solution Flow Time | 10 msec |
| Data Interval | 1 nm | Mixing Ratio | 1:1 |
| Measurement Interval | 0.10 sec | Volume of Solution Flow | 50 μL |
| Measurement Time | 0-3 seconds | The measurement is started when the syringe is stopped. | |
L-ascorbic acid was dissolved in NaOH/Na2HPO4 to acquire a final concentration of 20 mmol/L and the pH was adjusted to 7.6. Aqueous solutions of DCIP were used at a concentration of 1 mmol/L.
Keywords
260-UV-0017, FS-110 fast scan spectrophotometer, UV-Visible/NIR, SFS-852 Stopped-flow system, Stopped-flow Measurement program, Reaction Rate Calculation program
Results

Figure 1 shows the 3D spectra of the DCIP reaction. When the reaction begins, the spectra has an absorption maximum around 600 nm which coincides with the sample exhibiting a blue color. Within 1 second after starting the measurement, the absorbance drops to approximately zero and the sample changes to colorless.
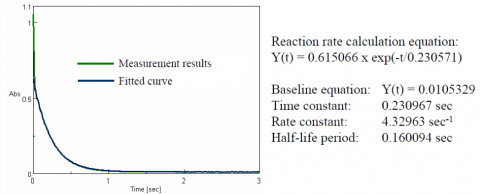
Figure 2 shows the time course absorbance data at the absorption maximum (604 nm) and the curve fitted to the reaction data between 30 milliseconds and 2.0 seconds. The reaction is assumed to be a primary reaction, and the fitted results are in excellent agreement with the measured results. Using the Reaction Rate Calculation program, a reaction rate of 4.3 sec-1 was calculated.
Featured Products:
-
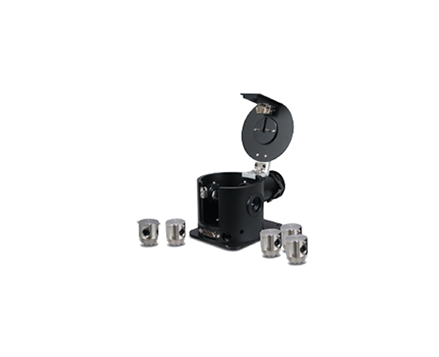
Stopped-Flow
-
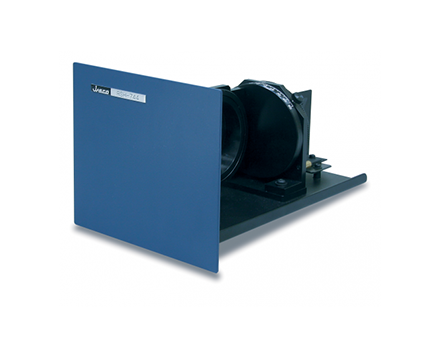
Film Holders for UV-Visible/NIR Spectrophotometers
-
Uniquely optimized for NIR applications with extended wavelength measurement to 1010 nm.
FP-8650 NIR Spectrofluorometer

Rapid Kinetic Measurement of 2,6-Dichloroindophenol using a UV-visible Absorption Stopped-Flow System
Introduction
An absorption stopped-flow measurement system is designed to measure rapid enzymatic, catalytic, and oxidation/reduction reactions. The system consists of the FS-110 fast scan spectrophotometer and the SFS-822 stopped-flow accessory and allows from two to four liquid samples to be rapidly mixed. Stopped-flow absorption spectra can be measured in 5 msec intervals to acquire reactions occurring at millisecond timescales.
This application note illustrates how the absorption stopped-flow system can determine the reaction rate for the reduction of 2,6-dicholorindeophenol (DCIP), whose color in aqueous solution changes from to blue to colorless as a result of its reaction with L-ascorbic acid.
Experimental
| Measurement Conditions | |||
| Spectrophotometer | Stopped-Flow System | ||
| Optical Pathlength | 2 mm | Solution Flow Time | 10 msec |
| Data Interval | 1 nm | Mixing Ratio | 1:1 |
| Measurement Interval | 0.10 sec | Volume of Solution Flow | 50 μL |
| Measurement Time | 0-3 seconds | The measurement is started when the syringe is stopped. | |
L-ascorbic acid was dissolved in NaOH/Na2HPO4 to acquire a final concentration of 20 mmol/L and the pH was adjusted to 7.6. Aqueous solutions of DCIP were used at a concentration of 1 mmol/L.
Results
Figure 1 shows the 3D spectra of the DCIP reaction. When the reaction begins, the spectra has an absorption maximum around 600 nm which coincides with the sample exhibiting a blue color. Within 1 second after starting the measurement, the absorbance drops to approximately zero and the sample changes to colorless.
Figure 2 shows the time course absorbance data at the absorption maximum (604 nm) and the curve fitted to the reaction data between 30 milliseconds and 2.0 seconds. The reaction is assumed to be a primary reaction, and the fitted results are in excellent agreement with the measured results. Using the Reaction Rate Calculation program, a reaction rate of 4.3 sec-1 was calculated.
Keywords
260-UV-0017, FS-110 fast scan spectrophotometer, UV-Visible/NIR, SFS-852 Stopped-flow system, Stopped-flow Measurement program, Reaction Rate Calculation program