Single-Layer Carbon Nanotube
August 23, 2022
 Download This Application
Introduction
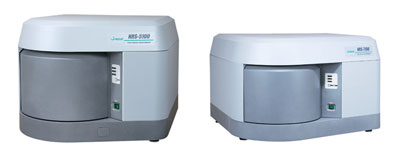
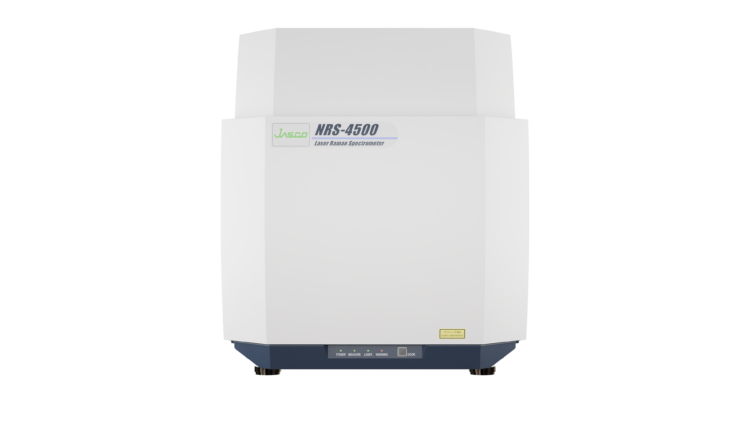
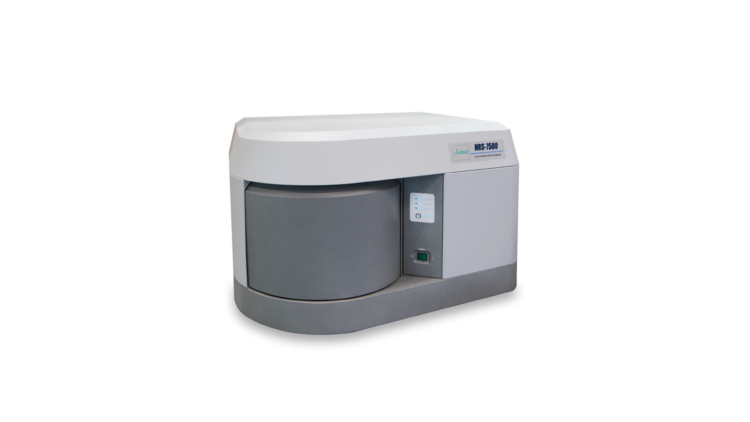
Raman Spectrometers
Raman Spectrum of Carbon Nanotubes
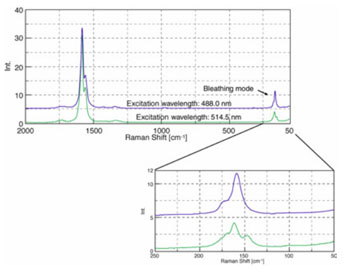
The figure outlines a measurement example for single-layer carbon nanotubes. For single-layer carbon nanotubes, the breathing mode, which depends on tube diameter, is observed in the low wavenumber region (up to 250 cm-1). This mode exhibits an excitation wavelength dependence, enabling us to determine the nanotubes diameter by measuring the excitation wavelength dependence. Information on the crystallinity and its loss are obtained from the bands at ~ 1,600 cm-1and near 1,350 cm-1, which are attributed to the structure of graphite. Because measurement of these samples is easy with Raman spectroscopy, it is widely used to complement SEM and TEM measurements.
Featured Products:

Single-Layer Carbon Nanotube
Introduction
Raman Spectrometers
Raman Spectrum of Carbon Nanotubes
The figure outlines a measurement example for single-layer carbon nanotubes. For single-layer carbon nanotubes, the breathing mode, which depends on tube diameter, is observed in the low wavenumber region (up to 250 cm-1). This mode exhibits an excitation wavelength dependence, enabling us to determine the nanotubes diameter by measuring the excitation wavelength dependence. Information on the crystallinity and its loss are obtained from the bands at ~ 1,600 cm-1and near 1,350 cm-1, which are attributed to the structure of graphite. Because measurement of these samples is easy with Raman spectroscopy, it is widely used to complement SEM and TEM measurements.